By Tatiana Schlossberg, The New York Times, July 27, 2017
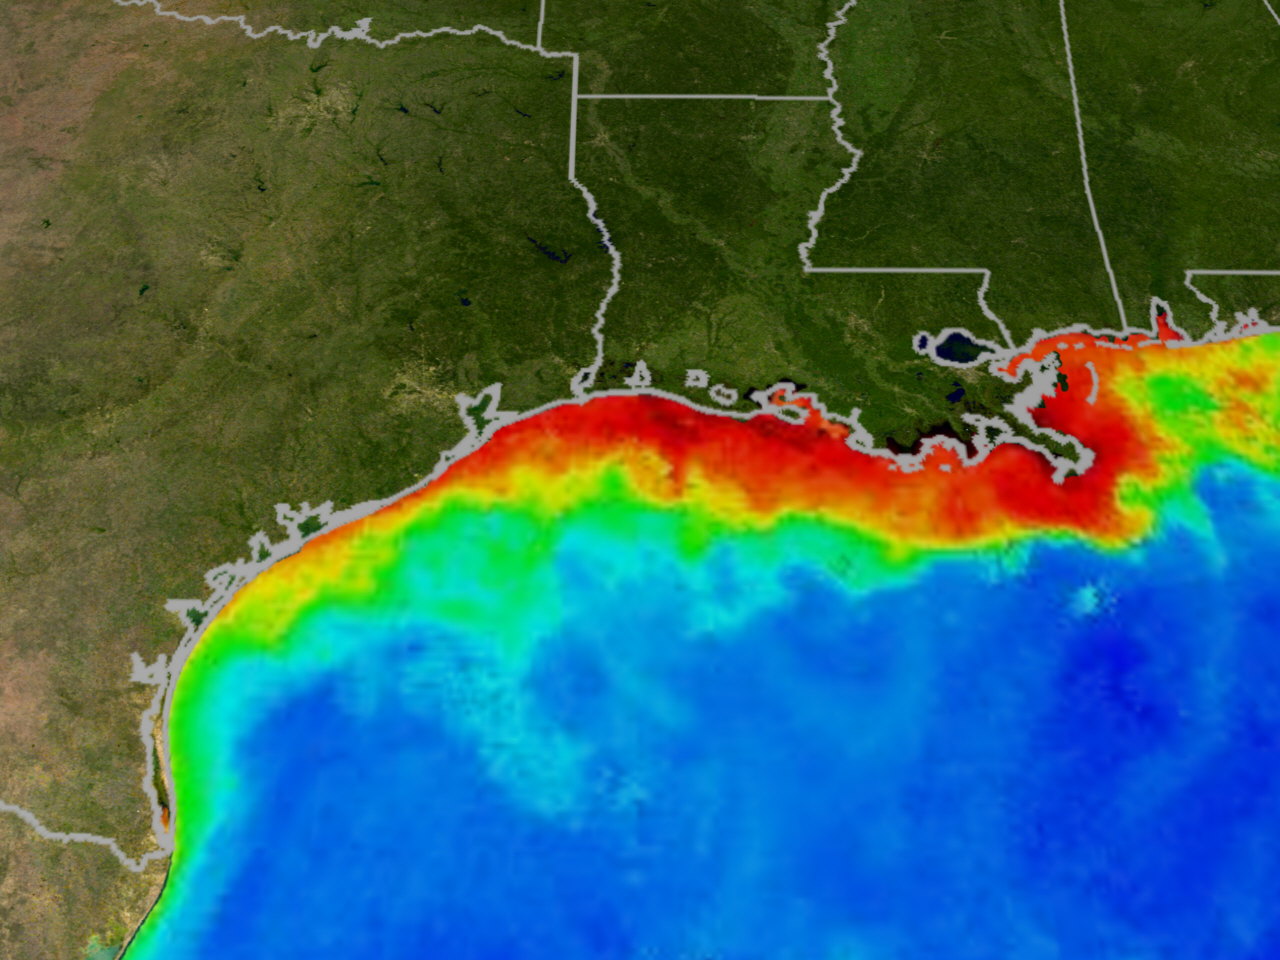 |
| Caused by chemical fertilizer use by American industrial agriculture, the Gulf of Mexico dead zone is one of the largest in the world. |
Nitrogen-based fertilizers, which came into wide use after World War II, helped prompt the agricultural revolution that has allowed the Earth to feed its seven billion people.
But that revolution came at a cost: Artificial fertilizers, often applied in amounts beyond what crops need to grow, are carried in runoff from farmland into streams, lakes and the ocean. New research suggests that climate change will substantially increase this form of pollution, leading to more damaging algae blooms and dead zones in American coastal waters.
A study published Thursday in Science concludes that eutrophication, excessive nutrient enrichment, is likely to increase in the continental United States as a result of the changes in precipitation patterns brought by climate change. Heavier rains caused by warmer temperatures will cause more agricultural runoff, sluicing more nutrients into rivers, lakes and oceans.
The authors found that future climate change-driven increases in rainfall in the United States could boost nitrogen runoff by as much as 20 percent by the end of the century.
“When we think about climate change, we are used to thinking about water quantity — drought, flooding, extreme rainfall and things along those lines,” said Anna Michalak, a professor of global ecology at the Carnegie Institution for Science in Stanford, Calif., and one of the authors of the study. “Climate change is just as tightly linked to issues related to water quality, and it’s not enough for the water to just be there, it has to be sustainable.”
Excess nitrogen from the fertilizers can cause eutrophication in the ocean, which can lead to harmful algae blooms or hypoxia — reduced levels of oxygen that create conditions in which organisms can’t survive.
The study’s authors looked at three emissions scenarios — high, stable and falling — in both the near and far future in more than 2,100 “subbasins” or watersheds in the continental United States.
Their results show that in the high emissions scenario, which assumes that future greenhouse gas emissions trends follow those of the past, increased precipitation alone would cause “large and robust increases” in nitrogen amounts on the watershed scale, particularly in the Upper Mississippi Atchafalaya River Basin, the Northeast, and the Great Lakes basin.
In the stable emissions model, in which a rise in global surface temperatures by two degrees Celsius from preindustrial times is more than likely, the Northeast would still see a robust increase in nitrogen loading.
This is in part because the nitrogen accumulation will occur in areas that already are experiencing it, and because watersheds in the Northeast and elsewhere drain into coastal regions where nitrogen pollution is already affecting water quality, the study said.
For instance, the Chesapeake Bay has experienced a “dead zone,” a result of hypoxia, regularly since 1950. Earlier this summer, the National Oceanic and Atmospheric Administration predicted a larger than average dead zone there, despite previous efforts at reducing nutrient levels.
The most notorious dead zone in the country surrounds the mouth of the Mississippi River in the Gulf of Mexico, which this year is expected to cover an area approximately the size of Vermont, nearly 10,000 square miles, according to research from Louisiana State University.
While the researchers did not specifically model the global effects of climate change on nitrogen loading in other parts of the world, they applied their models to analogous areas outside the United States. They found that large areas of East, South and Southeast Asia may experience increases in nitrogen levels similar to those seen in the United States.
Because these regions are home to more than half of the world’s population and are heavily dependent on surface water, the authors write, the effects of increased eutrophication are likely to be stark, turning the green revolution rather brown.
Farmers and agricultural authorities must take account of climate change and the prospect of increased rainfall in designing strategies to mitigate the effects of nutrient pollution. Otherwise, Ms. Michalak said, “They’re going to fail.”
Farmers and agricultural authorities must take account of climate change and the prospect of increased rainfall in designing strategies to mitigate the effects of nutrient pollution. Otherwise, Ms. Michalak said, “They’re going to fail.”


