By , , , , , , , , and Timothy D. Searchinger,
Abstract
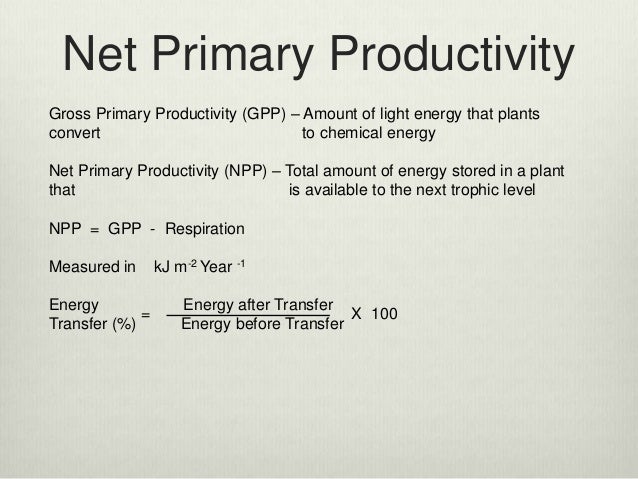 |
| Ultimately, all species live off energy that arrives on Earth via sunshine. Through photosynthesis green plants (primary producers) convert solar energy into sugars. They consume about half of it for their own livelihood. What remains is called Net Primary Productivity (NPP). The NPP is the basis for all animal life. Herbivores eat plants to gain energy for their livelihood (primary consumers). Finally, some carnivores live off herbivores (secondary consumers). Some omnivores eat secondary consumers (tertiary consumers). The final link in the food chain is the decomposers that live off the organic matter of plants, herbivores and carnivores. In each step in the food chain about 90% of the energy is lost. |
Abstract
Global increases in population, consumption, and gross domestic product raise concerns about the sustainability of the current and future use of natural resources. The human appropriation of net primary production (HANPP) provides a useful measure of human intervention into the biosphere. The productive capacity of land is appropriated by harvesting or burning biomass and by converting natural ecosystems to managed lands with lower productivity. This work analyzes trends in HANPP from 1910 to 2005 and finds that although human population has grown fourfold and economic output 17-fold, global HANPP has only doubled. Despite this increase in efficiency, HANPP has still risen from 6.9 Gt of carbon per y in 1910 to 14.8 GtC/y in 2005, i.e., from 13% to 25% of the net primary production of potential vegetation. Biomass harvested per capita and year has slightly declined despite growth in consumption because of a decline in reliance on bioenergy and higher conversion efficiencies of primary biomass to products. The rise in efficiency is overwhelmingly due to increased crop yields, albeit frequently associated with substantial ecological costs, such as fossil energy inputs, soil degradation, and biodiversity loss. If humans can maintain the past trend lines in efficiency gains, we estimate that HANPP might only grow to 27–29% by 2050, but providing large amounts of bioenergy could increase global HANPP to 44%. This result calls for caution in refocusing the energy economy on land-based resources and for strategies that foster the continuation of increases in land-use efficiency without excessively increasing ecological costs of intensification.
Although planet earth is finite, the growth of world population and economic activity result in an increasing demand for natural resources and ecosystem services. Concerns about these trends have motivated prominent scholars to define a new geological era, the “anthropocene” (1, 2). Changes in land use are particularly pervasive (3, 4) because human activities now affect approximately three-quarters of all vegetated lands (5). In the next four decades, population is expected to grow by 40% (6), the world economy could grow by a factor of 3 over its present value (7), and agricultural production is expected to grow by 60–100% (8, 9). Moreover, influential energy strategies advocate expanding bioenergy severalfold from its present value of ∼50 exajoule (EJ)/y (10, 11). At the same time, there are concerns that humanity is already outside its safe operating space in terms of nitrogen use, climate change, and biodiversity loss and near other critical limits such as land use (12) or biomass production of green plants (13). The ability of humanity to respect planetary boundaries (12) will depend on its ability to decouple growth from its demand for resources (14).
The capacity of land to produce biomass is one critical limiting resource (13). Although humans can influence that capacity through inputs and management, net primary production (NPP) is limited by land area, water, solar radiation, and soils. Biomass provides humans with food, fiber, and fuel, but it is also an indispensable resource for all other animals and microorganisms. Its annual production replenishes the carbon in soils and vegetation that is consumed by those animals and microorganisms and returned to the atmosphere (15) and, in some areas, generates the terrestrial carbon sink that helps to hold down climate change (16).
The human appropriation of the earth’s land capacity to produce biomass provides a useful measure of the human alteration of the biosphere. In previous work (17), we have defined this appropriation by the term “HANPP” for human appropriation of net primary production, which is the total carbon produced annually by plant growth. Total HANPP, measured in units of carbon, is the sum of two subcategories: HANPPluc and HANPPharv. HANPPharv is the quantity of carbon in biomass harvested or otherwise consumed by people, including crops, timber, harvested crop residues, forest slash, forages consumed by livestock, and biomass lost to human-induced fires. HANPPluc is the change in NPP, also measured as annual carbon flow, as a result of human-induced land use change, such as the conversion of forest to cropland or infrastructure. The calculation of HANPPlucrequires the estimation of the NPP that would be generated by the potential natural vegetation if vegetation were left unaltered, which we term NPPpot. We estimate NPPpot by using the global vegetation model Lund Potsdam Jena (LPJ) (SI Appendix), and use statistical data and thematic maps to estimate other inputs to HANPP (SI Appendix). From NPPpot, we can also calculate HANPP as a percentage of the potential productivity.
Because the carbon content of biomass is closely associated with its energy content, HANPP provides a set of indicators for measuring human effects on flows of trophic energy in natural ecosystems and managed lands (15, 17). HANPP can be used to calculate the intensity and the efficiency with which each hectare of land is used. Previous papers estimated HANPP and its major components for the 1980s (15, 18) and the year 2000 (17, 19, 20).
In this work, we present a global time series of HANPP over the last century, disaggregating by world regions and land use type. The goal is to provide insights into how changes in population and the economy have altered HANPP (21) that can be used to project future scenarios and to appreciate the implications of different policies that affect land use. Based on these data, we address several questions: (i) How much, and at what pace, did the human impact on the biosphere, measured by HANPP, change over the last century? (ii) How have global megatrends like growth of population and GDP influenced HANPP? (iii) To what extent have people improved their efficiency in using the land’s potential productivity to meet their needs and, thereby, decoupled HANPP from population and economic growth? (iv) How have regional patterns of HANPP changed, and what explains those differences? (v) How might HANPP evolve in the coming decades if current trends were to continue, and how would a strong increase in bioenergy demand alter the picture?
Results
During the last century, total human appropriation of plant growth has almost doubled (Fig. 1A). Global HANPP measured in GtC/y grew by 116% and by 2005 reached 14.8 GtC/y. As a percentage of the potential plant growth of native vegetation (NPPpot), HANPP grew from 13% in 1910 to 25% in 2005.

Fig. 1.
Global HANPP throughout the last century. (A) Development of global HANPP by major land use type and human induced fires from 1910 to 2005. (B) Sensitivity of global HANPP trends to data uncertainty and different model assumptions. The standard estimate of HANPP (black line) is compared with a low and a high estimate and to an estimate excluding changes in NPPpot due to CO2 fertilization (constant NPPpot of 1990). HANPP is measured in GtC/y (1 Gt = 1 Pg = 1015 g or 109 t). See SI Appendix for details. (C) Biomass harvest (HANPPharv) and final consumption of biomass products (plant and animal based food, food, timber, fuel wood, and other industrial biomass use; tC/cap per y) grew largely in parallel with population. (D) HANPP intensity measured as HANPP per capita (tC/cap per y), HANPP per unit of GDP (kgC/1990 constant international dollars $ per y) and total HANPP per unit of biomass harvest (HANPPharv) (gC/gC) declined, indicating increasing land use efficiency.
Although HANPP grew, it grew at a far slower rate than population and the economy. During the same period, population grew by 274% and gross domestic product (GDP) (in constant 1990 dollars) grew by 1,655% (22). HANPP per capita has therefore declined from a world average of roughly 3.9 tC/cap per y to 2.3 tons of carbon per capita and y. The major per capita decline in HANPP occurred only after 1950, when HANPP was still 3.7 tC/cap per y. HANPP per dollar of GDP (1990 dollars) declined even more throughout this century from 2.5 kilogram of carbon/$ to 0.3 kgC/$ (Fig. 1D).
Despite uncertainties in the data and assumptions, these results are robust. Fig. 1B shows upper and lower estimates of the HANPP trajectory in the 20th century. These estimates take into account uncertainties of data on biomass harvest and of assumptions on HANPPluc due to soil erosion and deforestation (SI Appendix), which results in a growth rate of HANPP from 99 to 129%. Because data regarding population and GDP are much less uncertain, the ranges in efficiencies are therefore also comparable.
Although total HANPP per capita declined, the level of biomass consumed by each person has remained nearly constant. As shown in Fig. 1C, global biomass harvest (HANPPharv) and consumption of biomass products have risen in almost perfect correlation with global population growth. That is a rather remarkable result because per capita consumption of crops and animal products for food has increased greatly along with use of timber for products other than energy. Indeed, food production per capita has risen since 1961 by an average of 20% in all world regions except the former Soviet Union (SI Appendix, Fig. S1B). However, decline in bioenergy has offset these increases (SI Appendix, Fig. S1A). Overall, wood harvest per capita has declined because of the replacement of fuel wood by fossil fuels. At the same time, the replacement of draft animals by tractors freed up agricultural land for other crops, and in some regions, allowed some lands to revert to forests. For example, before 1950 in Austria, 15–20% of all agricultural land and biomass use was required to feed draft animals that were later replaced by fossil-fuel powered machinery (23). This reduction in draft power has probably been lower in regions where animal draft power played a smaller role and in parts of the developing world where animal power is still important today (24). Although efficiency gains contributed to the decline of HANPP per dollar, the lion’s share of that reduction was due to a decreasing reliance on food and timber harvest for total economic production.
Land Use Efficiency.
In the first half of the 20th century, the extraction of 1 ton of carbon in biomass for human use resulted in roughly 2.1 tons of HANPP in the global average. This ratio means that each ton of plants harvested required the manipulation of land that reduced total biomass production by more than an additional ton. However, by 2005, that ratio had declined to 1.6. This improvement in land use efficiency resulted from technological changes that progressed differently across the globe (see Regional HANPP Trends below).
In general, the improvement has occurred overwhelmingly because of the rise in crop yields. In the vast majority of the world’s lands, converting forest and grassland to cropland reduces NPP. Although irrigation and heavy use of fertilizer have increased NPP in specific regions such as the Nile delta or The Netherlands even above NPPpot, most croplands have lower NPP due to the shorter growing period of crops and to the inability of one or a few crops to use the total solar radiation and other productive resources as fully as a mix of native species (17). However, by increasing yields over the last 50 y, farmers brought cropland closer to replicating the productivity of native vegetation, which meant that HANPPluc decreased (Fig. 2). Per unit area, HANPPluc on cropland declined from 235 to 117 gC/m2 per y (Fig. 2B). That led to a decrease in the absolute quantity of HANPPluc on cropland from a peak in 1950 at 2.3 GtC/y to 1.6 GtC/y by 2005. In fact, HANPPluc was slightly lower in 2005 even than 1910 despite almost a doubling of cropped area from 7 million km2 to 13 million km2. As a consequence, HANPPluc on cropland as a percentage of NPPpot declined from 49 to 21%. That also meant that the share of harvest in total HANPP grew from 55% in 1910 to 70% in 2005.

Fig. 2.
HANPP on global croplands. Development of harvested NPP (HANPPharv) and productivity losses due to land change (HANPPluc) compared with potential NPP (NPPpot) and NPP remaining in ecosystems after harvest (NPPeco). Absolute values (GtC/y) in A; per unit of cropped area (gC/m2 per y) in B.
Unlike rising crop yields, increasing harvest from forest land and the expansion of land occupied by infrastructure, buildings, and associated land have contributed to increasing HANPP (Fig. 1A). However, they have played a relatively small role because agriculture dominates HANPP globally, representing 84–86% of total appropriation of plant growth over the entire period, with 42–46% on cropland and 29–33% on grazing land.
By contrast with cropland, we here assume that the land use efficiency of pasture and forest did not increase. Because of the lack of reliable data and contradicting evidence from case studies on how grazing and forestry impact NPP, we assumed HANPPluc to be zero for woodland and for nondegraded natural grasslands for the observed time period. We did, however, consider HANPPluc resulting from conversion of forests to grasslands or urban land and from soil degradation (SI Appendix).
Although we did not assume any decline in HANPPluc on grasslands over time as a result of rising grassland productivity, the output of meat and milk has grown greatly relative to the harvest of grass. In 1961, when reliable production data first exist, 29 tons of grazed biomass (dry matter) were used for the production of 1 ton of animal products; by 2005, this ratio was down to 17. This increase in efficiency results in part from a reduction in draft animals, in part from a shift from ruminants to monogastrics, which rely little on pasture, and in part from an increased use of high quality feed from cropland for ruminants. It also results from improvements in animal husbandry, but we cannot break out the separate components (25).
Regional HANPP Trends.
HANPP has grown in all world regions at a slower rate than population, and all regions experienced a declining significance of land use-induced productivity losses (HANPPluc) and a growing share of harvested NPP in HANPP (Fig. 3). Otherwise, the specific patterns of HANPP differ substantially. Asia, Africa, and Latin America experienced very high growth rates in HANPP; as a percentage, HANPP doubled or even tripled in these regions during the last century. With the expansion of agriculture, these regions caught up with or even surpassed the initially high HANPP percentage levels in the Western Industrialized region and the former Soviet Union and Eastern Europe (FSU-EE). In contrast, in the Western Industrialized region, HANPP grew only modestly. It rose from 18% to 23% of NPPpot in the 1980s and has stabilized since then. The development of HANPP in FSU-EE mostly tracked that in the Western Industrial region until 1990, but after the collapse of the Communist system and the disintegration of its agricultural production system, HANPP rapidly declined from 22% to 16% of NPPpot.

Fig. 3.
Development of HANPP and HANPP per capita from 1910 to 2005 in five world regions. HANPP (percent) measures HANPP as a percentage of the NPP of the potential vegetation, i.e., the vegetation assumed to exist in the absence of land use. Asia*, Asia excluding those countries which are part of the FSU-EE Region; FSU-EE, Former Soviet Union and Eastern Europe. See SI Appendix for definition of regions.
HANPP as a percentage of NPPpot has converged globally and falls into a relatively narrow range in all regions except Asia (ranging from 16% to 23% in 2005), but per capita HANPP varies greatly (Fig. 3). HANPP per capita reflects three key factors: one, the amount and mix of biomass products consumed per capita, which generally increases with income and consumption of more HANPP-intensive products such as meat and milk; two, the efficiency of biomass production relative to NPPpot; and three, net biomass imports or exports. Some of the factors that drive per capita HANPP are shown in SI Appendix, Table S1:
- i) Latin America has the highest HANPP per capita (5.8 tC/cap per y) because it has a relatively high level of biomass consumption, has only moderate yields compared with Asia, Europe, and North America, is a major world exporter, and produces a great deal of beef through relatively unproductive pasture from former forests, which entails a large HANPPluc.
- ii) Asia has the lowest HANPP per capita (1.3 tC/cap per y). This low figure results from an intensive and high-yielding production system, a low role for livestock products in diets, a lower-than-average level of wood consumption, and a heavy reliance on imports.
- iii) Africa is not only the region with the steepest increase in total HANPP, it also experienced a fast decline in HANPP per capita from 5.8 to 2.6 tC/cap per y. This decline is not comforting. The growth in HANPPluc is one measure of inefficiency of land use, and HANPPluc has been growing at faster rates in Africa than in any other region. HANPPharv has also increased, but the growth rate has still been much smaller than that of Africa’s rapidly growing population for a number of reasons: the number of livestock per capita declined considerably, yields have remained low, and the region has increased its reliance on imports of food.
- iv) In the Western Industrial region, a very high level of biomass consumption, high exports, and a considerable density of livestock are counterbalanced by a highly efficient production system and a resulting large decline of HANPPluc over time. HANPP per capita amounted to 3.5 tC/cap per y in 2005. It declined only moderately in the 20th century and remained more or less stable after 1980. Together with Asia, the Western Industrial region has the most HANPP-efficient biomass production system. The ratio of total HANPP to harvest in this region is 30% below the global average because of the lowest HANPPluc.
Future Scenarios.
The historic trends in the relationship of HANPP to population, GDP, and bioenergy use allow us to project five potential future scenarios for the development of HANPP until 2050 based on these trends (Fig. 4; SI Appendix):
- i) Scenario A projects HANPP based on the Organisation for Economic Co-operation and Development estimation that global economic output will grow by 246% between 2005 and 2050 (7). It also assumes a decline of 66% in the ratio of HANPP per dollar of global GDP based on the historic trend.
- ii) Scenario B extrapolates HANPP on the basis of population forecasts for each of the five world regions by using the medium variant of United Nations projection of 43% population growth between 2005 and 2050 (6). It projects a decline of HANPP per capita based on the regional trend lines.
- iii) Scenario C extrapolates HANPP from the assumptions that future demand for biomass products will follow population growth rates, that final biomass consumption per capita will remain constant at 0.3 tC/cap per y, and that HANPP per unit of final biomass consumption will decline by 26% toward the level observed in the Asia region, which has the lowest level of all five world regions.
- iv) Scenarios D and E are based on the intermediate scenario B but assume additional primary bioenergy production. Based on potential deployment levels of biomass for energy identified by the Intergovernmental Panel on Climate Change-Special Report on Renewable Energy Sources and Climate Change Mitigation (IPCC-SRREN) (10), we calculated a lower and an upper boundary value for biomass harvest for energy production in 2050: Scenario D assumes an additional 50 EJ/y and Scenario E an additional 250 EJ/y of primary bioenergy over the present level of approximately 50 EJ/y (26). We further assumed that agricultural biomass will supply 60% and forest biomass 40% of the increase, and that HANPP per unit of agricultural biomass harvest further declines by 32% based on historical trends. This trend implies a continued growth in production efficiency, which could include circumstances in which energy crop plantations achieve an NPP that exceeds native productivity (NPPpot).

Fig. 4.
Scenarios for the development on HANPP until 2050. Whereas scenarios A–C assume a continuation of past trends, scenarios D and E add additional primary biomass harvest to scenario B (see text and SI Appendix for details). Based on upper and lower boundary values for deployment levels of biomass for energy, we assumed an additional harvest for energy production of 50 EJ/y (scenario D) and 250 EJ/y (scenario E) over the present value. Continuation of past trends would result in moderate growth of HANPP until 2050. Increasing the production of bioenergy, however, could dramatically increase global HANPP (scenario E).
In effect, all scenarios assume continued progress in HANPP efficiency by using different metrics, and two scenarios add a growth in bioenergy. In the first three scenarios, we project that HANPP will rise modestly from 25% to between 27% and 29%. These impacts are small in percentage terms, but because the human impact on the biosphere is already so great, the increases of 7–17% of human appropriation of the world’s productive capacity still implies meaningful human impacts on land resources. The big change would be the high bioenergy scenario, which implies a growth in HANPP to 44%; that is, a 78% increase over the present value. That increase would occur despite growth in efficiencies of biomass production to 2050 based on historic progress.
The significance of these impacts must be based on the degree of stress caused by present biomass demand. According to the Food and Agriculture Organization (FAO), irrigated areas have expanded from 1.5 to 3.1 million km2 in the last 50 y (27) and water withdrawal for agricultural use has increased fivefold during the last century (28). Humans have doubled the reactive nitrogen in the environment (29) and invested large amounts of fossil energy in agricultural production (SI Appendix, Fig. S3). Agricultural area has reached 5–6 billion hectares depending on the definition of pasture area. Any further large expansion of agricultural area would likely have vast significance for the global carbon cycle and biodiversity (4, 9).
Discussion
Although growing human needs for food and feed could roughly be met during the last century by expanding cultivated land and increasing yields, our results, at the most basic level, show rising human pressures on the terrestrial biosphere despite large increases in land use efficiency. This rising pressure is a cause for future concern, given mounting evidence that humanity is already undermining the ability of global ecosystems to maintain vital ecosystem services (30) and has arguably trespassed critical planetary boundaries for biodiversity loss and release of reactive nitrogen (12).
At the same time, this rise in HANPP has been far smaller than would have occurred if agricultural yields had not risen and if per capita bioenergy demands had not declined. Cropland yield gains, measured in HANPPharv on cropland as a ratio of NPPpot, increased from 41% to 69%. That increase, spread out over all cropland in 2005, generated 2.5 GtC/y of crops, which met 49% of the total increase in human consumption from 1910. Although the importance of rising yields has been well known, HANPP provides a useful measure of these efficiency gains because it equates all crops based on their carbon content, relates it to the productivity in global land ecosystems and, hence, demonstrates the magnitude of human-induced changes to the global carbon cycle.
Our calculations also provide appropriate recognition of the importance of harvested crop residues. Their consumption has increased from 0.5 petagram of carbon (PgC)/y to 1.6 PgC/y even as crops have increased from 0.3 PgC/y to 1.8 PgC/y. This benefit grows in parallel with the growth in crop yields, and their importance cautions against the treatment of crop residues as if they were unused.
Although there are concerns about the increasing reliance of agriculture on energy use, our calculations indicate that, in pure energy terms, gains in output were larger than increases in inputs. Researchers have debated the relative contribution of fertilizer, plant breeding, irrigation, and other land improvements toward yield gains, but they generally conclude that the changes are more interactive than additive. For example, increased fertilizer has facilitated yield gains that require other measures as well but would not have been possible without fertilizer (31). Overall, we calculate that total energy used in agriculture both directly and for the production of fertilizer reached 13 EJ by 2005 (SI Appendix, Fig. S3), but the energy in crops and crop residues rose from 41 EJ in 1910 to 155 EJ in 2005. However, ecological costs of agricultural intensification go far beyond increased energy inputs and include impacts such as soil degradation, nutrient leaching, greenhouse gas emissions, and biodiversity loss (32, 33).
Our analysis also suggests the importance of focusing in the future on pasture productivity. Unlike crops, there is no evidence to support comparable increases in pasture productivity on larger scales. Indeed, the expansion of pasture on original forest land and soil degradation on grassland have resulted in an increase in HANPPluc, although the exact magnitude of this NPP loss is difficult to gauge with currently available data (SI Appendix). Further improvements in land use efficiency may depend heavily on improvements in pasture management, which are a focus of some climate change strategies (34).
Conclusions
For the next few decades, a further increase in global population and economic output is expected, and they will raise the demand for more biomass to produce food, fiber, and fuel. Our analysis of historic trends has shown that considerable efficiency gains in the past have driven a decoupling of socio-economic growth and HANPP, but only relative to population and GDP growth. In absolute terms, HANPP has continued to increase. Overall, people have to a fair extent managed to improve the efficiency with which they generate their food and fiber needs, but even with these improvements, the total tap on the world’s plant production has roughly doubled and the ecological costs were considerable. Even if these trends continue, HANPP is likely to increase significantly without increased reliance on bioenergy. Bioenergy at levels contemplated by the International Energy Agency (35) and in IPCC-SRREN (10) would have a transformative effect on the planet. As the world faces large new demands for food and timber products, that experience suggests caution in refocusing the energy economy on bioenergy, and stresses the importance of developing improved practices for sustainable intensification of land use (9, 33).
Materials and Methods
We refer to the concept of HANPP used in our previous work (17) and adapted the methodology used therein for application to historical time periods. Defining HANPP as the sum of HANPPharv and HANPPluc, we calculate HANPP for nine points in time (1910, 1930, 1950, 1960, 1970, 1980, 1990, 2000, and 2005) for up to 161 individual countries aggregated to five regions. At the global scale for the period 1961–2005, we also calculated a time series in annual resolution.
We use model runs of LPJ for managed lands, a biogeochemical process model of climate-dependent carbon and water dynamics in vegetation growth, to estimate NPPpot. HANPPharv includes biomass extracted for further economic use and biomass killed by harvest and by human-induced fires. The method to calculate biomass harvest is adapted from previous work (3, 36). Data on used extraction of crops and timber come from FAO and its precursor (SI Appendix). For the years 1910 and 1930, primary data are not available for all countries. We extrapolate total flows for each region from information on reporting countries and their relative contribution to the total regional flow in 1950. Grazed biomass was estimated on the basis of feed balances by using livestock and market feed data from FAO and demand factors that considered species, region, and time. Grazed biomass is calculated as the difference between modeled dry matter demand and available market feed, fodder crops, and by products used as feed. Extraction of crop residues, harvest losses in forestry, and below-ground biomass on cropland and harvested forest areas are estimated by using region and time-dependent coefficients. The amount of biomass killed in human-induced fires (deforestation) was taken from the literature (37), complemented by an estimate of biomass killed in swidden agriculture (SI Appendix).
HANPPluc is the difference between NPPpot and NPPact, i.e., the productivity of the vegetation prevailing at each point in time. Negative values of HANPPluc indicate that fertilization or irrigation raised productivity above its natural level. NPPact on cropland is extrapolated from crop harvest and calculated crop residues. We use coefficients to estimate belowground NPP and NPP losses during the growing season (SI Appendix). We assume that HANPPluc on artificial grassland (grassland on areas with potential forest cover) was 20% of NPPpot (17); estimates of HANPPluc due to human-induced degradation come from data from a previous study for the year 2000 (38), extrapolated backward by assuming that the ratio between HANPPluc and grazed NPPharv is not changing. This approach yields similar results as the combination of spatially explicit datasets on degradation extent and degree for the late 20th century (38, 39) with time series of NPPpotand pasture land (40), which we take as an indication that our basic approach is valid, given the large data gaps.
HANPPluc on natural grasslands, on forest, and on unused land (e.g., wilderness areas) is assumed to be zero. The extent of land used for infrastructure, buildings, and associated areas like gardens or parks relies on population data and per capita values and an assumption that the amount of built-up land varies with income and population density by region and over time (SI Appendix). HANPPharv on built-up land (e.g., mowing lawns and cutting trees) is assumed to be 50% of NPPact (as in ref. 17).
Acknowledgments
This work was supported by Austrian Science Funds Projects P20812-G11 and P21012-G11, European Union–Seventh Framework Programme Project 265104 (Visions of Land Use Transitions in Europe), the Social Sciences and Humanities Research Council of Canada, and European Research Council Starting Grant An integrated socio-ecological approach to land-use intensity: Analysing and mapping biophysical stocks/flows and their socioeconomic drivers (LUISE) 263522. This work contributes to the Global Land Project (www.globallandproject.org).
Footnotes
- ↵1To whom correspondence should be addressed. E-mail: fridolin.krausmann@aau.at.
- Author contributions: F.K., K.-H.E., and H.H. designed research; F.K., K.-H.E., S.G., H.H., A.B., V.G., C.L., and C.P. performed research; F.K., K.-H.E., S.G., H.H., V.G., C.L., C.P., and T.D.S. analyzed data; and F.K., K.-H.E., H.H., and T.D.S. wrote the paper.
- The authors declare no conflict of interest.
- This article is a PNAS Direct Submission. W.L. is a guest editor invited by the Editorial Board.
- This article contains supporting information online at www.pnas.org/lookup/suppl/doi:10.1073/pnas.1211349110/-/DCSupplemental.
Freely available online through the PNAS open access option.
No comments:
Post a Comment