Showing posts with label U.S. elections. Show all posts

Saturday, November 9, 2024

3657. Why Trump Again: A Note on the 2024 U.S. Elections

By Kamran Nayeri, November 8, 2024


Editor's Note: The Farsi edition of this short commentary was published in the socialist website Critique of Political Economy (نقد اقتصاد سیاسی). The free English translation is by the author. 

*.    *.     *

Contrary to the expectations of Democratic Party supporters, the victory of Trump and the Republican Party in November 2024 elections was complete.  Peter B. Baker, who wrote a book about Trump, wrote in the New York Times on November 6: "The assumption that Mr. Trump  is a fleeting  phenomenon and will soon be consigned to the dustbin of history on Tuesday night as the red wave swept  through the country, including in those states that did not yet  favor  either presidential candidate. It was wrong." Three reporters from Reid Epstein, Lisa Lerer and Nicholas Nehamas, wrote on Nov. 7 that 

“What was indisputable was how badly Democrats did. They lost the White House, surrendered control of the Senate and appeared headed to defeat in the House. They performed worse than four years ago in cities and suburbs, rural towns and college towns. An early New York Times analysis of the results found the vast majority of the nation’s more than 3,100 counties swinging rightward since President Biden won in 2020.”

They quote Bernie Sanders that the Democratic Party “which increasingly has become a party of identity politics, rather than understanding that the vast majority of people in this country are working class. This trend of workers leaving the Democratic Party started with whites, and it has accelerated to Latinos and Blacks.”

However, it would be a mistake to reduce the reasons for the Democrats' defeat to economic issues. There is a tendency to distrust both parties, especially the Democrats. In 2020, Trump received 74,223,975 votes. But in this election, 71,353,269 people voted for him, which is 2,870,708 less. In 2020, Biden received 81,283,501 votes, but Harris in 2024 has 66,405,656 votes, which is 14,867,845 fewer votes. Both parties had fewer votes in this election, but Democrats have lost more support. 

One reason for this is that the Democratic Party has surpassed the Republicans in its imperialist warmongering policies. Among the "achievements" of the Biden administration are his push to expand NATO and fan the flames of war in Ukraine and unconditional support for Israel's genocidal war in Gaza and its extension the West Bank, Lebanon, and now Iran. Democrats berate Trump and his Republican supporters as "isolationists" because they have less appetiate for U.S. military interventions around the world. American Arabs and Muslims, who usually voted for Democrats, have voted for Trump in their majority. The reason for this is Biden's support for Zionism and Israel's war in Gaza. 

Kamala Harris called Trump a fascist in her election campaign.  Liberals and some leftist currents also call the Trump phenomenon as fascism. They cite his anti-immigrant politics, especially against Latinos and Muslims, his misogyny, and anti-democratic and authoritarian actions and ideas. During his presidency small fascist armed groups calling themselves militias were  active and they were involved in the riots of January 6, 2021. 

However, this situation is fundamentally different from what existed in Germany, Italy and Spain in the 1920s and 1930s analyzed by socialists as fascism. Fascism at that time was a bourgeois in response to the vast and deep crisis of capitalism in Europe when there was also mass trade unions and powerful social-democratic and Communist parties, and as the Soviet Union was rapidly industrializing and arming itself. At that time, the capitalist classes found themselves in serious and immediate danger of the socialist revolution. Fascism was created to crush the workers' and socialist movements by large organized and armed anti-labor and anti-communist fascist groups. In the United States today, there are no mass trade unions, powerful socialist and communist parties, or any "communist" states that threaten capitalism. On the contrary, capitalism dominate the whole world facing no serious opposition. 

The Relative Decline of American Imperialism and Capitalist Political Crisis

The Industrial Revolution of England (1830-1870) turned that country into the superpower dominating the world economy. However, Germany and the United States went through their industrial revolution at the end of the 19th century and overtook England economically with the creation of modern industries and new products by 1913. The First and Second World Wars were fought to create a new order between the imperialist powers.  At the end of World War II, the United States became the global capitalist superpower. Some have called this period the "American Century." 

However, since 2000, the top position of the United States has been threatened by the industrialization of China, which has a population of 1.5 billion. Currently, China produces 20% of the world's industrial products, mainly for export,  while the share of the United States,  which was 40% in 1960, has fallen to 18%.  China  excels in modern infrastructure, new industries, and new products, and is highly competitive in the global market. Meanwhile, China's domestic market  is expanding rapidly with a middle class estimated to be about 300 million. In contrast, the United States has a total population  of 330 million people, and  its middle class  is shrinking. China's economy is still growing by the engine of industrial development, but the U.S. economy is largely dependent on the service sector, which makes for slower  productivity and economic growth. 

The  relative economic decline of the United States has threatened its military position. Although after the collapse of the Soviet Union in 1991, it seemed that the United States had become the  hegemonic power in a unipolar world, it soon became a multipolar world. and now the dominance of the United States in challenged in the Pacific, the Middle East, Africa, and even Latin America, which Washington has called its “backyard” since the time of Monroe Docterine of 1823.

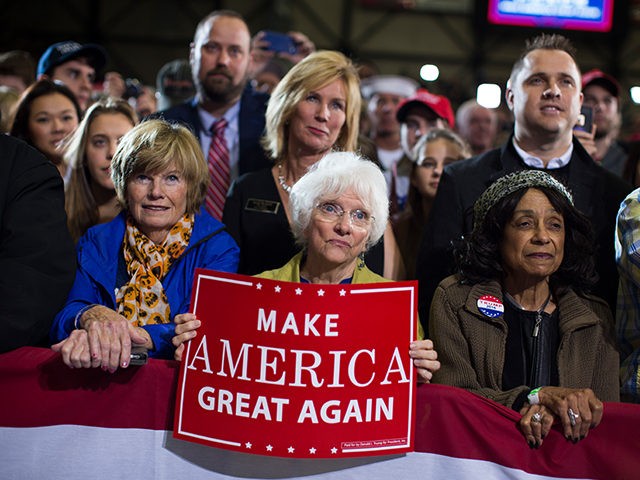
The process  of deindustrialization in the United States due to globalization has  weakened some industries and regions and led to the decline  of the U.S. middle class—especially the white working-class aristocracy—which has ignited the flames of reactionary nativism, white nationalism, and retrogressive capitalist economic views. The Trump phenomenon and its slogan "Make America Great Again” have emerged in this context. 

The neoliberal policies that had been embraced by both parties since the Reagan presidency have long exhausted their use to uplift the U.S. economy. Democratic Party politicians have opted for Keynesian fiscal and monetary policies to modernize the infrastructure and develop new  industries and new products, along with social policies to motivate the working people and strengthen the middle  class to increase productivity growth and expand  the domestic and global market of the United States. 

The intensification of the conflict over these strategies between the Democratic and Republican parties are the result of the relative decline of U.S. imperialism. 

The 2024 presidential and congressional elections should be examined in this context 

The Need for an Independent Ecocentric-Based Socialist Policy

Neither of the two parties of US imperialism and their presidential candidates paid any attention to the urgent needs of the working people in this country and globally. Today, humanity and life on the planet face four existential threats: catastrophic climate change, the Sixth Extinction, recurrent pandemics, and nuclear holocaust. Two bloody wars, one in Ukraine between Western imperialism and Russian imperialism, and the other, an expanding genocidal war by the colonial-settler state of Israel in Gaza, now expanded to the West bank, Lebanon and even to a war with Iran which will require direct U.S. military intervention in the Middle East. 

The root cause of all these crises is the anthropocentric industrial capitalist civilization which both parties uphold and defend. Instead, both parties supports the $1.7 trillion program for the modernization of the U.S. nuclear arsenal and currently the U.S. military preparation for war with China. 

Just as the two world wars of the twentieth century were aimed at creating a new order between the imperialist powers, the economic rivalry between China and the United States could quickly escalate into a war between the two nuclear powers. In the war in Ukraine, there were several overt threats of use of nuclear weapons by Putin. According to press reports, Biden explored the possibility of using nuclear weapons against Russia last April. 

The future of humanity and life on the Earth depend on the development of independent power mass organizations the working people to transcend anthropocentric industrial capitalist civilization in the direction of Ecocentric Socialist society worldwide, especially in the United States.  

Sunday, November 8, 2020

3446. US Election: Women, the Young, the Working Class, the Cities and Ethnic Minorities Get Rid of Trump

By Michael Roberts, Michael Roberts Blog, November 8, 2020


The Democratic party candidate, Joe Biden has beaten the Republican party incumbent Donald Trump for the US presidency in 2020.  What can we learn from election results about the United States of America, the world’s greatest imperialist power, in the third decade of the 21st century?

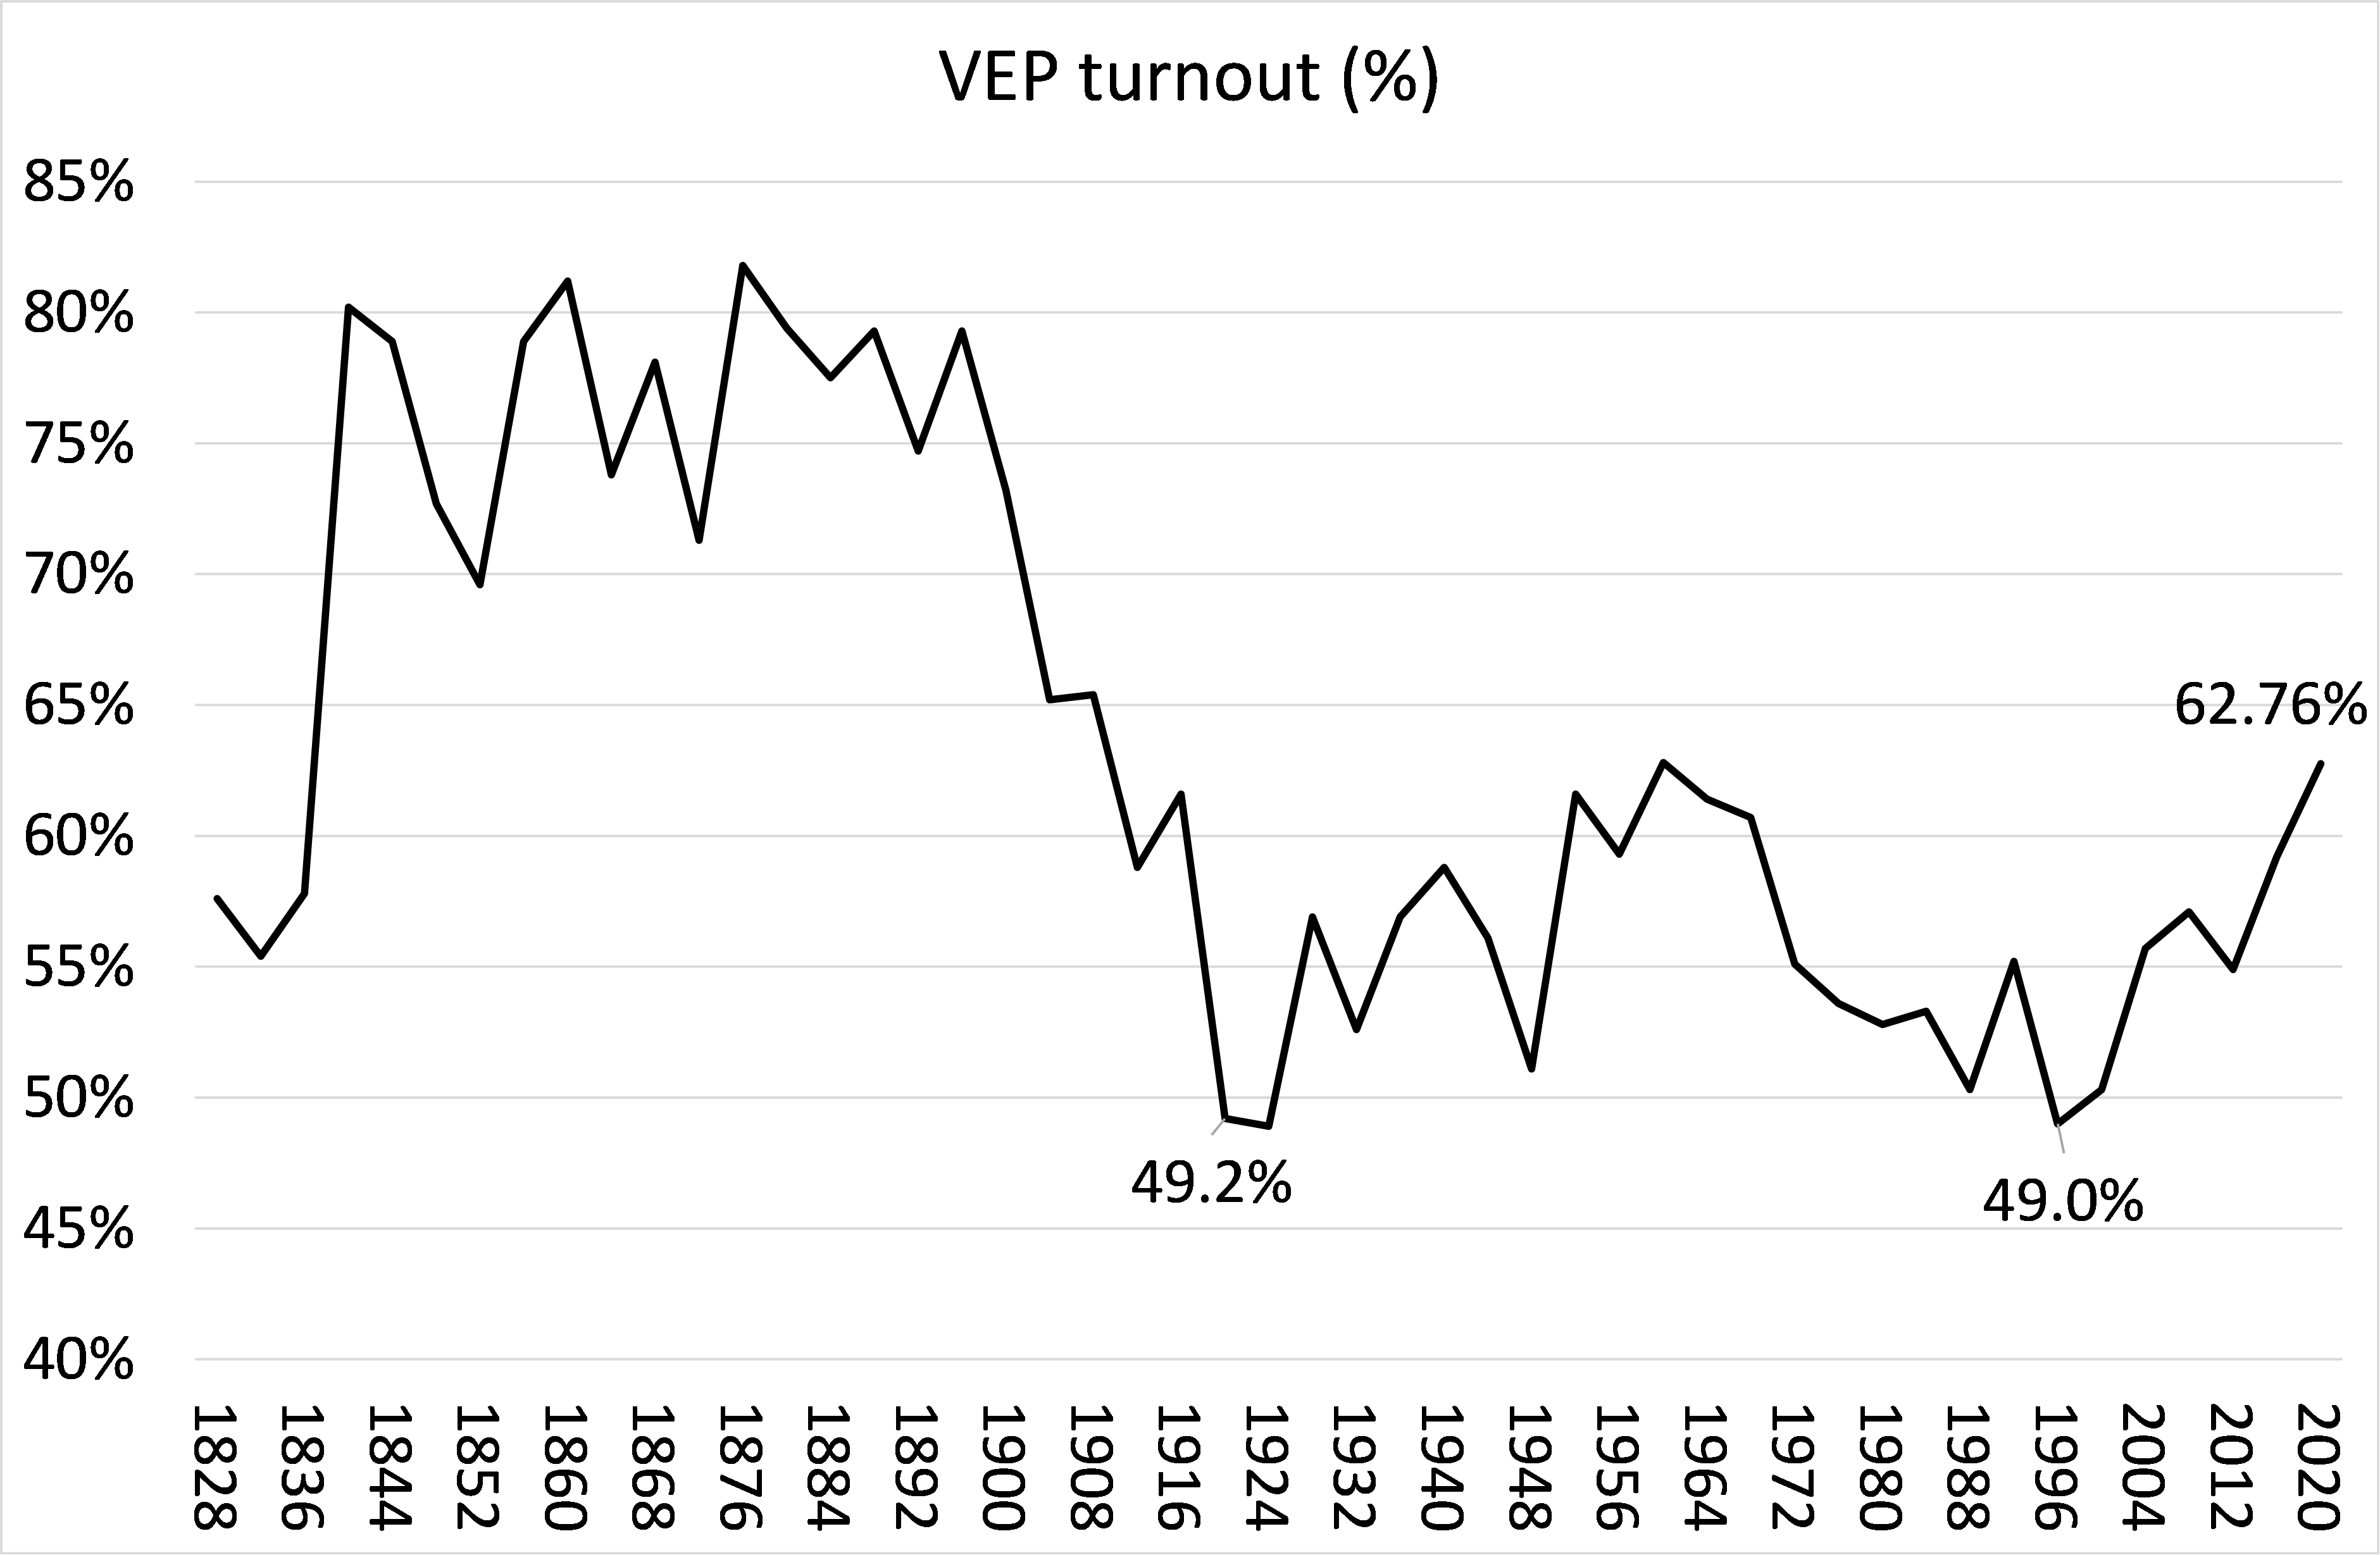
First, the voter turnout.  With not all the votes even now yet counted, it seems that about 150m Americans of voting age will have cast their ballots. Given that there were 239m eligible to vote, that means there was about a 62% turnout (VEP).

That’s better than in 2016 at 59% and the best turnout since 1960, but it’s not as high as many media forecasts were claiming on the day of the election.  It means that 37% of Americans entitled to vote did not do so.  That compares with 31.4% who voted for Biden and 29.6% who voted for Trump.  So once again, the No Vote party polled the highest national vote in the US election.

Moreover, there were another 20m voting-age Americans excluded from the poll for various nefarious reasons (they had committed a felony or the state administration had refused their registration).  So the voting age turnout was just 58%, implying that a sizeable section of America’s working classes did not vote and/or were not allowed to vote.  Indeed, the ‘greatest democracy in the world’ has one of the lowest levels of voter participation of the major so-called ‘liberal democracies’.

One large slice of the population that does not exercise its right to vote is young Americans. Less than half — just 43.4% — of eligible Americans under 30 voted in the 2016 presidential election. This was much less than the 71.4% of over-60s who voted. It was even lower in this election.

Trump is saying that the election was rigged and in a way he is right.  It is always rigged because the candidate with the majority of votes, let alone just the largest vote, seldom wins.  In this election, Trump polled over 71m votes, the highest vote ever for a Republican.  But Biden polled 75m votes, the highest vote ever for a president. But that’s because just more people voted in this election than ever before.

In the last eight presidential elections, the winner has polled less votes his main opponent. This is because the winner is the one that receives most ‘electoral college’ votes.  And those votes are recorded from each state of the 50-state union. It is the United States of America, a federal union of sovereign states as formed in the American revolution of the 18th century, with each state having its own laws and electoral procedures.  So building up huge votes in New York and California, the most populous states, for the Democrat candidate does not guarantee victory when narrow winning margins are achieved in lots of small states by the Republican candidate that add up to a majority in the electoral college.

So in 2016, Democrat Hillary Clinton polled 3m more votes than Trump overall, but Trump took 306 electoral college votes because he won very narrowly in a series of small to medium size states in the middle West. This time, Biden has polled even more of majority, probably about 4m, but the result appeared close because of the narrow margins in key ‘swing states’.  But this time Biden took those states back from Trump and on 6 January when the electoral college meets, he will get 306 electoral votes to win, the same as Trump got in 2016.

Another reason the election result was close is that in the Republican-run states, there has been significant gerrymandering of the voting boundaries, deliberate blocking of voter registration and in this election a desperate attempt to foil massive postal balloting during the COVID pandemic.  US ‘democracy’ is a joke.  According to the Economist, it is at the bottom of the pile as a ‘liberal democracy’, with only Albania scoring lower!

The reason the turnout was higher this time is partly the intense polarisation in America during the COVID pandemic and the economic collapse; fuelled by Trump’s demagogic tirades. But also the COVID pandemic lockdowns led to a massive increase in postal voting, an easier process for voters than going to the polling centres.  There were also significant grassroots campaigns in the big cities to get people registered and voting.

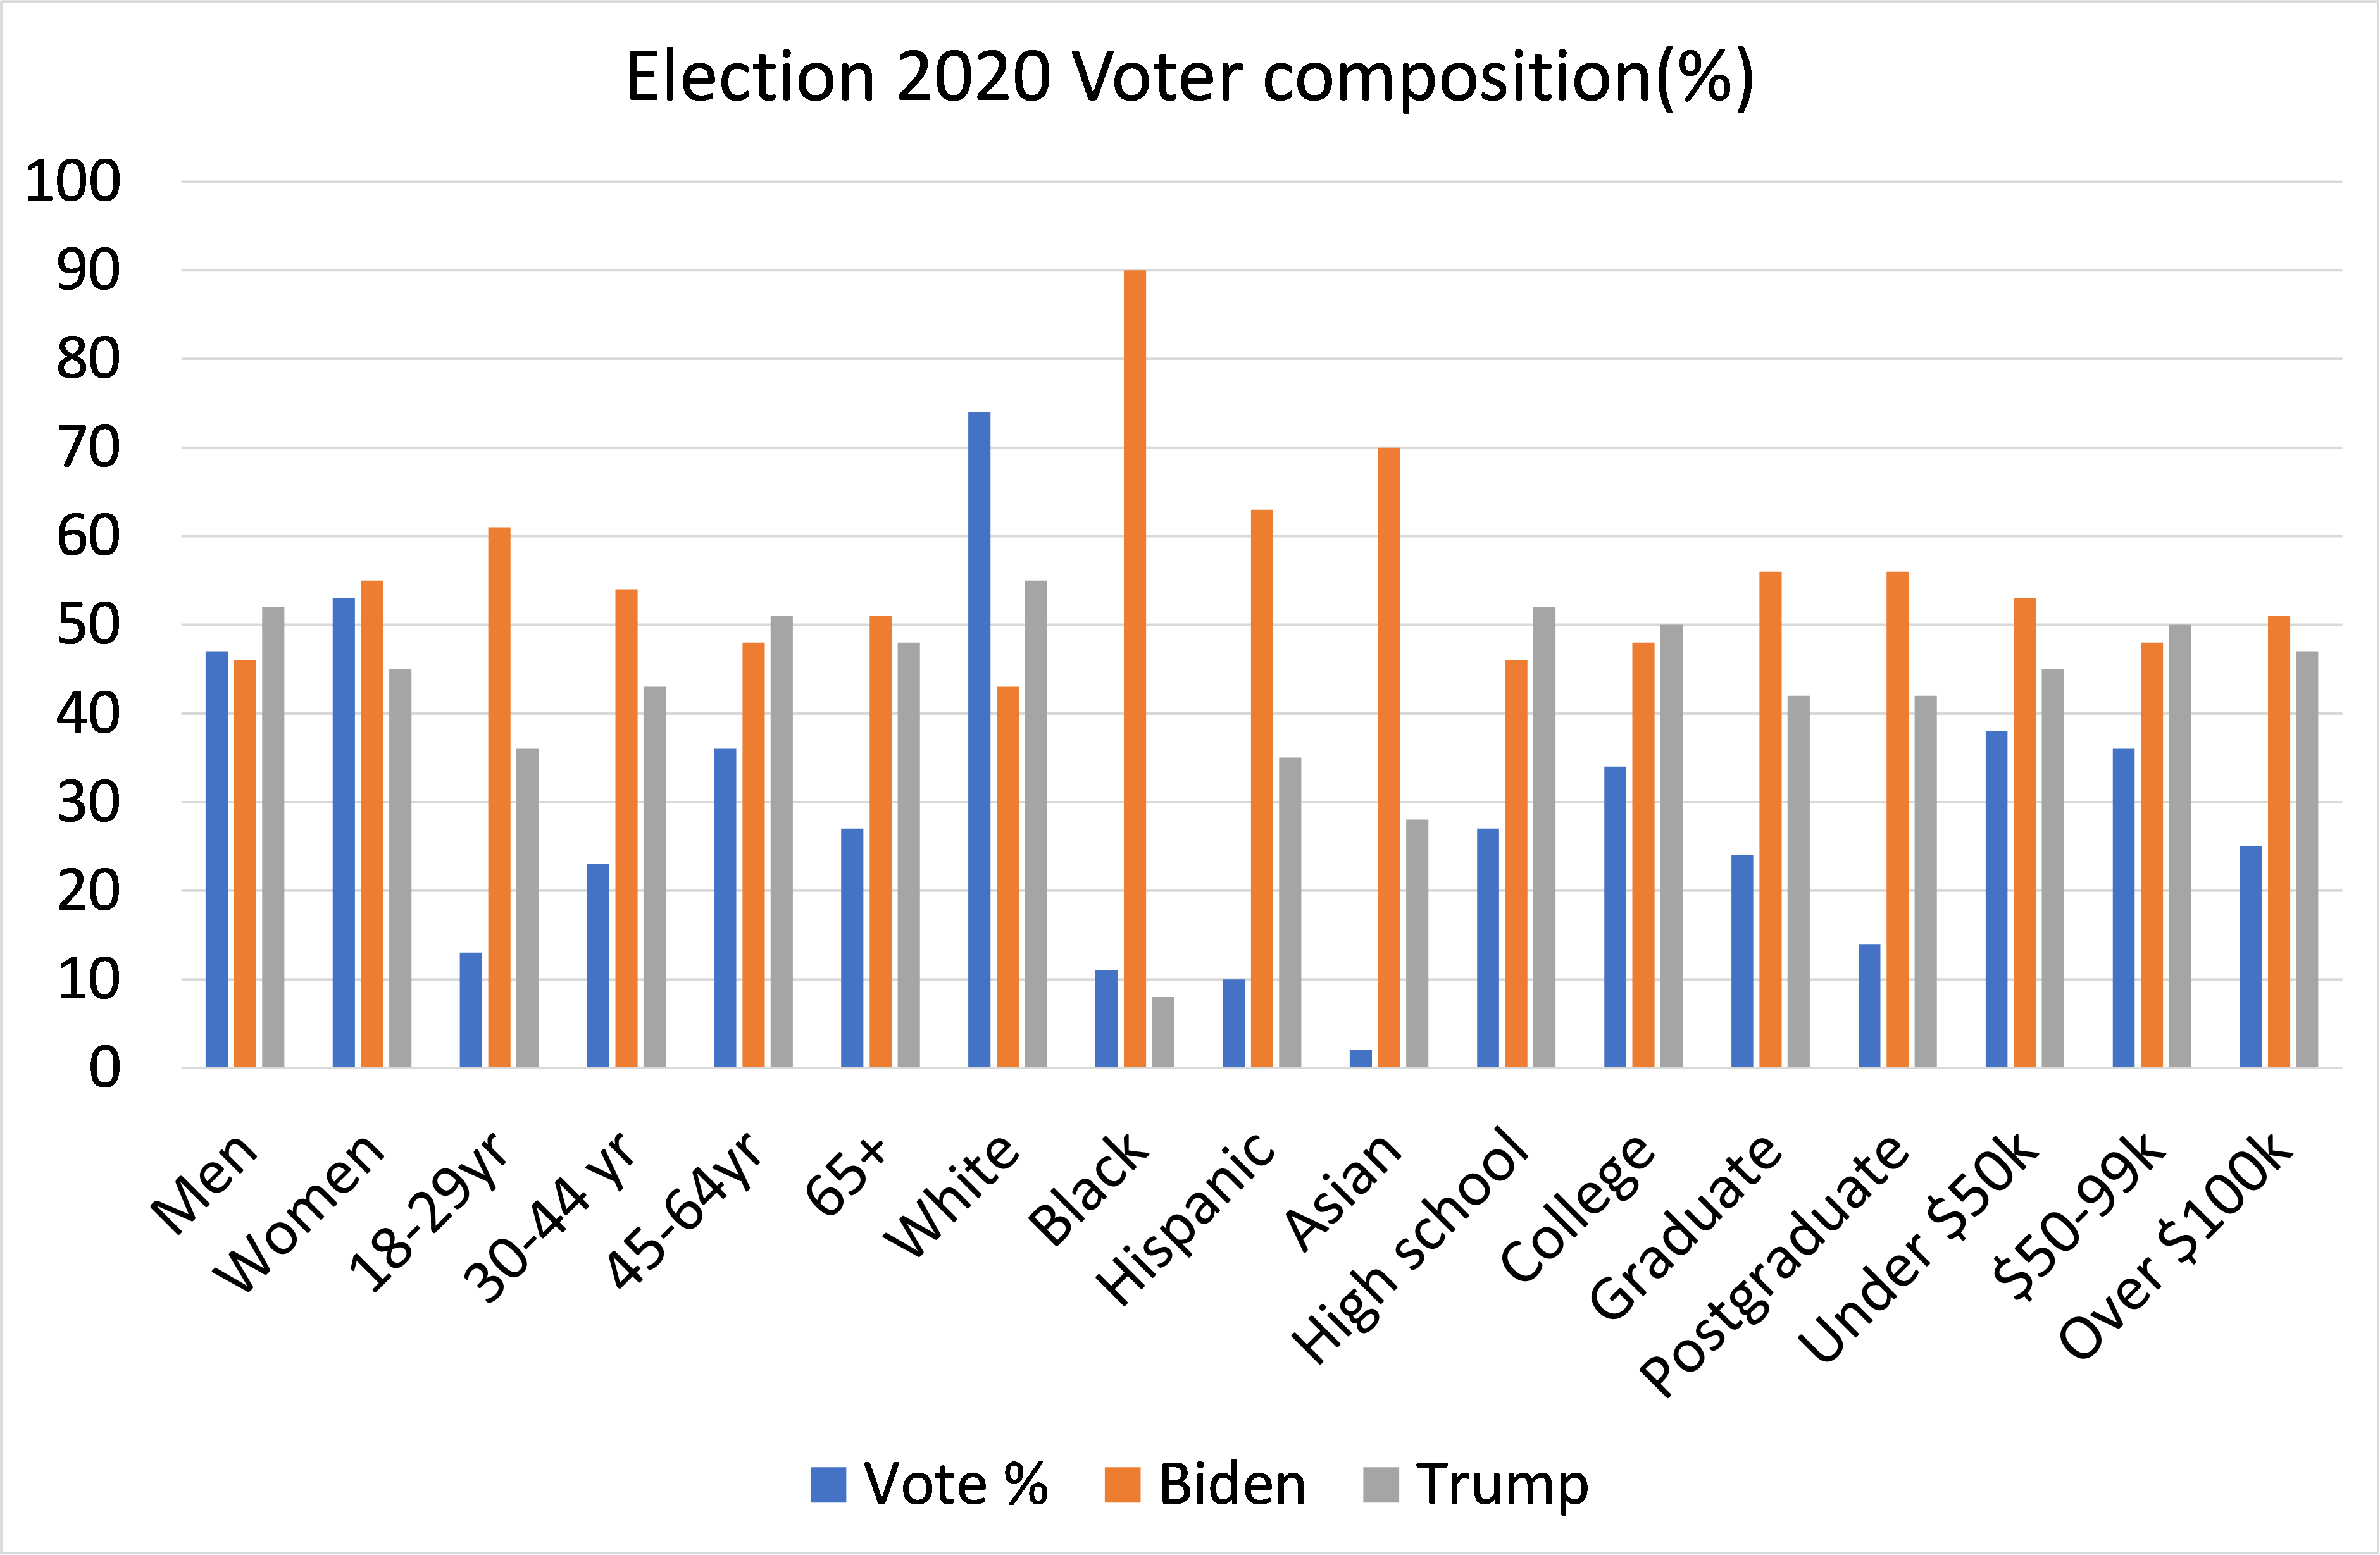
Can we learn anything from the demographics and economic composition of those who did vote?  The Votecast survey of voters gives us some clues.  According to the survey, male voters (47%) split 46-52 for Trump, but female voters (53%) split 55-45 for Biden. So women voters ensured a Biden victory.

The youth vote, as usual, was low, just 13% of the total vote, but those under 29 years voted 61-36 for Biden. And those aged 30-44 years (23% of the vote) also backed Biden 54-43.  Those aged 45-64 (a huge 36% of the vote) went narrowly for Trump 51-48. And those over 65 years (another sizeable chunk of 27%) again narrowly voted for Trump 51-48.  So 63% of those who voted were older than 44 years and backed Trump (narrowly); while those under 45 (just 37% of the vote) heavily backed Biden. That was enough to overcome the small majorities for Trump in the older age groups.

What about ethnic groups?  Well, the survey found that 74% of the voters were white and they backed Trump 55-43.  But all other ethnic groups overwhelmingly backed Biden.  Black Americans constituted only 11% of those voting, but they backed Biden 90-8.  Hispanic voters were only 10% of the total but they backed Biden 63-35.  Asian voters were only 2% of the vote but backed Biden 70-28. This 25% of the voters (and growing in size in each election) so overwhelmingly backed Biden that it was enough to overcome the smaller Trump majority among the white voters.

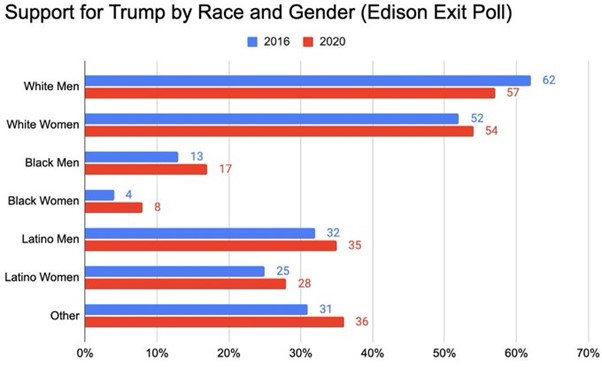
Much has been made of the supposed increased vote for Trump by black and Hispanic Americans this time compared to 2016.  But the evidence for this is dubious and even if true, the shift is tiny.  According to the Edison exit poll, there was a fall-off in support by white men for Trump compared to 2012 from 62% to 57% and small rise from white women from 52% to 54%. The supposed rise in support for Trump from black men was 13% to 17% and from black women was from 4% to 8%.  But considering that white voters were 75% of the vote and black voters were only 11%, the supposed shift to Trump from black voters is less than half the loss by Trump from white voters.  More Hispanic voters backed Trump this time, it is claimed, but still around two-thirds did not.

What about classes and incomes?  Well, by level of education, high school leavers (27% of voters) backed Trump 52-46; and those with some qualifications (34% of voters) again backed Trump but narrowly 50-48.  College graduates (a sizeable 24% of voters) heavily backed Biden 56-42 and postgraduate voters (some 14%) were even more strongly pro-Biden 56-42.  The more educated, the more Biden.

But that did not mean that working class Americans backed Trump more than Biden.  Those voters earning $50,000 a year (the median average income) or less backed Biden significantly 53-45, and they were 38% of voters.  Those in the middle-income group of $50-99k a year (36% of voters) narrowly backed Trump 50-48, while those earning over $100k a year (25% of voters) actually backed Biden 51-47.  The lowest paid Americans, the largest group of voters voted for Biden by a good margin, while the small-business people and middle income earners narrowly backed Trump. The better-off backed Biden (but I suspect that the higher up the income scale, the more votes for Trump, as other surveys show that millionaires heavily backed Trump).

Yes, there is a sizeable minority of working-class Americans that backed Trump, mainly in small towns and rural areas. But the majority of working-class Americans rejected Trumpism.  The urban areas (65% of votes) heavily backed Biden while the small towns and rural areas heavily backed Trump.  It was here that the polarisation in the vote was greatest.

Religion also played a role.  Protestant Christian believers and evangelicals (45% of voters) voted heavily for Trump while Catholics (22%) were split 50-50 and muslims, Jews and declared atheists (25% of voters) backed Biden hugely.

What were the main issues of the election?  Two stand out: the COVID-19 pandemic and the state of the economy.  The pandemic was considered the most important by 41% of voters and those that thought so backed Biden heavily. The economy and jobs were regarded as the most important issue by 28% of voters who heavily backed Trump. Here was another clear cause of polarisation in America: lockdowns to save lives; or no lockdowns and save jobs was how many Americans saw it in 2020.

To sum up, Americans turned out for this election in slightly larger numbers, but the turnout was still way down compared to other ‘liberal democracies’. They voted even more strongly for the Democratic candidate than in 2016, but the constitutional peculiarities of the election system made the result quite close – although, more or less, in line with pollster forecasts.  Biden won because America’s ethnic minorities overcame the white majority.  Biden won because younger Americans voted for Biden sufficiently to overcome Trump majorities among older voters. Biden won because working class Americans voted for him in sufficient numbers to overcome the votes of the small town business-people and rural areas.

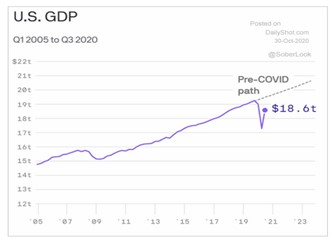
The US election was a mess; mirroring the mess that US imperialism is now in, with the COVID pandemic running riot across America and the economy on its knees with millions unemployed, wages slashed and public services paralysed.

Biden had the backing of the majority of workers, ethnic minorities, young people and city dwellers.  They voted to get rid of Trump: but they may not expect much from Biden and they will be right.

Monday, June 19, 2017

2634. The Democrats Put Trump in the White House

By Kim Moody, Solidarity, January-February 20017
Photo: AP/Even Vucci
THE MEDIA STORY in the days following the 2016 election was that a huge defection of angry, white, blue-collar workers in the Rust Belt from their traditional Democratic voting patterns put Donald J. Trump in the White House in a grand slap at the nation’s “liberal” elite. But is that the real story?

While he didn’t actually win the popular vote, Trump did carry the majority (58%) of white voters. Furthermore, he won the key “battleground” states in the Rust Belt that are the basis of the media story, which raises serious questions. Who were these white voters? Was this the major shift that sent Trump to victory?

Exit polls taken during the primaries, when the Trump revolt began, showed that the whole election process was skewed toward the better-off sections of U.S. society and that Trump did better among them than Clinton. Looking at those voters in the general election from the 26% of U.S. households earning more than $100,000, who are unlikely to be working class these days, we see that Clinton got 34% of her vote, and Trump a slightly larger 35% of his, from these well-to-do voters.(1)

In other words, upper-income groups were overrepresented in the voting electorate as a whole, and both candidates drew a disproportionate part of their vote from the well-to-do, with Trump a bit more reliant on high-income voters. This in itself doesn’t rule out a working-class shift to Trump, but the media’s version of this is based on a problematic definition.

Among other problems, a large majority of those without a college degree don’t vote at all. Furthermore, people who don’t vote are generally to the left of those who do on economic issues and the role of government. Of the 135.5 million white Americans without degrees, about a fifth voted for Trump — a minority that doesn’t represent this degreeless demographic very well.

Another problem is that there are only about 18.5 million white, blue-collar production workers — the prototype of the defecting white industrial worker.(2) If we double this to account for adult spouses to make it just under 40 million and assume that none of them have degrees, it still only accounts for a little more than a third of those white adults lacking the allegedly class-defining degree.

Of course, there are another 14 million or so white service workers who are working class, but even if we include them and their spouses we still account for only about half of the huge 70% of white adults in the United States who lack a college degree.

There are also millions of Americans who don’t have a college degree, who are not working class, and who are actually more likely to vote than the “left behind” industrial workers. There are some 17 million small business owners without that degree. As a 2016 survey by the National Small Business Association tells us, 86% of small business owners are white, they are twice as likely to be Republicans as Democrats, almost two-thirds consider themselves conservative (78% on economic issues), and 92% say they regularly vote in national elections.

They drew an average salary of $112,000 in 2016 compared to $48,320 for the average annual wage.(3) Add in the spouses, and this classically petty-bourgeois group alone could more than account for all the 29 million of those lacking a college degree who voted for Trump.(4)

There are also 1.8 million managers, 8.8 million supervisors, and 1.6 million cops whose jobs don’t require a college degree. To this we could add insurance and real estate brokers and agents, and so on.(5) Some may have a degree, but it is clear that there are tens of millions of non-working class people in the United States who lack such a degree, and who are more likely to be traditional and frequent Republican voters than a majority of white, blue-collar workers.

The relatively high-income levels of much of Trump’s vote point toward a majority petty bourgeois and middle-class base for Trump, something The Economist concluded in its earlier survey of Trump primary voters when they wrote, “but the idea that it is the mostly poor, less-educated voters who are drawn to Mr. Trump is a bit of a myth.”(6) The first point, then, is that Trump’s victory was disproportionately a middle-class, upper-income phenomenon.

Trump’s Union Vote

To test the extent to which white, blue collar or related workers handed Trump victory, we will look at the swings in union household voting in national elections. This is far from perfect, of course, since only a minority of workers belong to unions these days, about half are public employees, and non-white workers make up a quarter of the total.

Nevertheless, we can safely assume that any swings toward the Republicans came mostly from white union members and their families. It is important to bear in mind as well that the union household vote has declined as a percentage of the total vote in presidential elections from about 26-27% in 1980 to 18% in 2016 so that the impact of the union household vote has diminished though not disappeared.(7)

Union Household Vote in Presidential Elections, 1976-2016

YearDem.Rep.
201651%43%*
201258%40%
200859%39%
200459%40%
200059%37%
199660%30%
199255%24%
198857%43%
198048%45%
197662%38%
*Additionally, in 2016, 6% other/no answer; in 2000, 1% Buchanan, 3% Nader; in 1996, 9% Perot; in 1992, 21% Perot; in 1980, 7% Anderson
Source: Roper Center, “How Groups Voted”, 1976-2012, 
http://ropercenter.cornell.edu/polls/us-elections/how-groups-voted/how-groups-voted/; CNN politics, election2016, “Exit Polls, National President”, 

Two things are clear from the table. First, an average of about 40% of union members and their families have been voting Republican in presidential elections for a long time, with the Democrats winning a little under 60% of the union household vote for the last four decades. Only in 1948 and 1964 did over 80% of union household members vote for the Democratic candidate, Harry Truman and Lyndon B. Johnson respectively.(8)

Nevertheless, in 2016 a relatively small number shifted to Trump from 40% for the Republican in 2012 to 43% in 2016. This three percentage points represents a shift of just under 800,000 union household voters across the entire country.

Even more interesting is that the Demo­cratic vote fell by seven points from 2012 to 2016 as union household members defected to a third party, refused to answer the question when surveyed, or didn’t vote and weren’t surveyed. While the unspecified “no answer” group of those surveyed lends some credibility to the theory of the “silent Trump voter,” this drop nonetheless points to the fact that the Democrats have lost votes since 2012.

Putting this in historical context, Trump’s shift of union household voters is actually less dramatic than the swing from 1976 to 1980 for Reagan, and even less so than the 14-point desertion of union household voters from Carter in 1980, half of which went to independent John Anderson rather than Reagan, in an election when union householders composed 26% of all voters.(9)

In other words, Trump attracted both a smaller proportion and number of these voters than Reagan or Anderson. These same voters have swung for some time between Democrats, Republicans, and high-profile third-party candidates such as Anderson, Ross Perot who got 21% of union household voters in 1992, and Ralph Nader, who got three percent in 2000.(10) The meaning of the 2016 shift was more sinister to be sure, but it was also long in the making as the Democrats moved to the right.

This is not to say that the swing of union household or white working-class voters away from the Democrats doesn’t reflect the conservative social views, racism, and in the 2016 election, the sexism of many white working- and middle-class people as well as their anger at their deteriorating situation.

Clearly, Trump won almost 10 million union household votes, compared to almost 12 million for Clinton. These numbers are significant, but we know that many are not as new to voting Republican as is often thought. This, of course, is not something to take comfort in, but it is an indication of the results of the Democratic Party’s choice to emphasize higher-income people that began under Bill Clinton and the Democratic Leadership Council.(11)

It seems clear that a significant number of white working-class people voted for Trump who had voted for Obama in 2008 or 2012 — even if more just didn’t vote.

The Democrats’ Self-Made Debacle

While there was a swing among white, blue-collar and union household voters to Trump, it was significantly smaller than the overall drop in Democratic voters.

While recent voter suppression laws demanding state-issued photo IDs in some 17 states along with the racial cleansing of voter rolls in many states have undoubtedly limited voting for Blacks, Latinos and low-income whites, most non-voters don’t vote because they don’t see anything compelling to vote for.

At the same time, working-class voter participation has remained low in part because the political parties have reduced the direct door-to-door human contact with lower-income voters in favor of purchased forms of campaigning, from TV ads to the new digitalized methods of targeting likely voters.(12)

Vast amounts of personal data are accumulated by firms specializing in this, turned into voter-targeting algorithms, and sold. According to John Aristotle Phillips, the CEO of Aristotle, they can provide customers with “up to 500 different data points on each individual.”(13) The parties or campaigns that purchase this service, in turn, use it to spread targeted messages to specific groups or even individual voters mostly via the internet through various platforms, including Facebook which apparently made a bundle off the 2016 election.

Spending on digital political ads rose from $22 million in 2008 to $158 million in 2012, and is expected to hit $1 billion for the 2016 election and over $3 billion by the 2020 elections. No doubt they will continue to soar as they are increasingly available for elections way down the ballot to the local level according to the Democratic digital outfit DSPolitical.(14)
Aside from the soaring costs this invasive digital targeting adds to U.S. elections and the further erosion of our privacy, it further removes political campaigning from any direct human contact. As reporters for The Guardian put it, “campaigns of the future will depend as much on being able to track people across screens and apps as knocking on doors or sending out flyers.”(15)

It’s not that no doors are knocked on or phone calls made, but the algorithm that decides the limited number of actual voters to be visited or called to turn out the vote in practice has meant identifying the better-off part of the population. The Get-Out-The-Vote campaign has become the Get-Out-The-Well-To-Do-Votes canvass. More importantly, the shaping of the political process, already an auction, is being even further outsourced to the profit-making “expert” firms that provide this service.

In short, despite all the vast amounts of money raised and deployed, all the digital and “expert” sophistication available to this “party of the people” and Clinton’s allegedly massive “ground game” force in the “battleground” states, the Democratic Party as a whole no longer can or tries to mobilize enough of those among its traditional core constituencies — Blacks and Latinos, as well as white workers and union members — to win national and even state offices in these key states.

To be sure, Clinton won the popular vote nationally, perhaps as John Nichols gloated in The Nation by an “unprecedented” margin that might run as high as two million or more. The problem is that 1.5 million of that can be accounted for from Clinton’s margin over Trump in New York City alone.(16) The majorities in the coastal states of California and New York by themselves accounts for more than her net majority; the rest of the country continues to see its Democratic vote stagnate or decline.

The Democrats are and have been for decades the party of the (neoliberal) status quo when millions of all races have seen their living standards shrink and future prospects disappear and, as a result, have come to despise the status quo. And as the many millionaire Democrats in Congress (average wealth of a Democratic Representative is $5.7 million) and their business buddies demonstrate for all to see, they are part of the nation's elite.

The decline in manufacturing jobs, the shrinking of union representation, the creation of more and more lousy jobs, the withdrawal of aid to the cities, etc. have created not just “angry white men” who voted for Trump, but angry white, Black, Latino and Asian men and women who, for good and sound reasons, no longer see the Democrats as their defenders.
Many in this legion have voted with their feet, and it wasn’t to the polls. In 2014, the last off-year Congressional election, non-voters numbered almost 128 million adult citizens — a majority of eligible voters(17) — the vast majority of these were middle-to-lower income working-class people.

Strong evidence that the Democrats can no longer motivate or mobilize the majority in much of the country is the fact that the millions of non-voters are on average and in their majority politically to the left of those who do vote on key economic issues.

As one study put it, “Nonvoters tend to support increasing government services and spending, guaranteeing jobs, and reducing inequality” more than voters, by about 17 percentage points. This includes whites as well as Black and Latino non-voters.(18)
The Democrats cannot mobilize the forces needed to defeat the right, in part because they cannot implement any policies capable of addressing the plight of the majority that might attract these left-leaning non-voters.

Nationally the Democrats have been losing elections at just about every level since 2009. In that year, during the 111th Congress, the Democrats had 257 members in the House of Representatives. By 2015, in the 114th Congress that was down to 188 Democrats, the lowest number since the 80th Congress in 1947-49, over which time voter participation rates fell from 48% to 42% in off-year Congressional elections.

In 2016 the Democrats won back just six seats in the House.(19) Between 2009 and 2015 the Democrats lost 203 seats in State Senates and 716 in State Houses or Assemblies. An indication of what was to come in Ohio and Pennsylvania in 2016 could be seen in the loss of 21 Democratic seats in the state legislatures of each of these states between 2009 and 2015.(20)

Consequences of Failure

This time, however, the falling Demo­cratic vote meant the victory not of a run-of-the-mill conservative or even a Tea Bagger, but of a racist demagogue bent on doing serious damage. And he will.

There will be resistance. Rather, there will be increased resistance. And this will offer new possibilities for organizing, even in a more hostile atmosphere. At the same time many, including not a few on the socialist left, will run for cover in the Democratic Party’s “Big Tent,” arguing that now is not the time to take on the Democrats, that the great task is to elect a Democratic Congress, any Democratic Congress, in 2018 to rein in Trump just as the Republicans blocked Obama after 2010, and so on.

But such a political direction will only reinforce the Democrats’ neoliberalism, digital-dependency, and failed strategies. We had better bear in mind what this approach has not done for the past four decades and will not do in the coming years.

It will not significantly or permanently increase voter turnout for working-class people, especially African-American and Latino voters. The rate of voter turnout has fallen for the past few decades and particularly for off-year Congressional elections.

Both Black and Latino rates of voter participation in off-year elections, long below average, have nose-dived since 2010 and did not recover in 2016 despite the threat of a Trump victory.(21)

Nor will the centrist liberalism, much less neoliberalism, of Democratic incumbents and most likely candidates, win back those white working-class people or those in union households who have been voting Republican for decades, much less the recent angry Trump converts.

Politics as usual have failed! Who put Trump in the White House? The Democrats.

Notes

  1. Nate Silver (2016) “The Mythology of Trump’s ‘Working Class’ Support,” FiveThirtyEight, May 3, 2016, http://fivethirtyeight.com/features/the-mythology-of-trumps-working-class-support/; CNN politics (2016).
    back to text
  2. US Census (2014) Table 1, “Educational Attainment of the Population 18 years and Over, by Age, Sex, Race, and Hispanic Origin: 2014” CPS, 2104, https://www.census.gov/hhes/socdemo/education/data/cps/2014/tables.html.
    back to text
  3. NSBA (2016) NSBA 2016 Politics of Small Bus­iness Survey. Washington DC: National Small Business Association, 4-6; SBA (2016) Demographic Char­acteristics of Business Owners and Employees, 2013. Washington DC: US Small Business Administration Office of Advocacy, 1; BLS (2015) Occupational Employment Statistics, “May 2015 National Occupational Employment and Wage Estimates United States”, www.bls.gov/oes/current/oes_nat.htm#00-000; Indeed (2016) “Small Business Owner Salary,” www.indeed.com/small-business-owner.htm.
    back to text
  4. CNN politics (2016),  “national president,” http://edition.conn.com/results/exit-polls.
    back to text
  5. BLS (2014b) “Occupational employment, job openings and worker characteristics,” Table 1.7, www.bls.gov/emp/ep_table_107.htm.
    back to text
  6. The Economist (2016) “Where Donald Trump’s support really comes from,” April 20, 2016, http://www.economist.com/blogs/graphicdetail/2016/04/daily-chart-14?zid=297&ah=3ae0fe266c7447d8a0c7ade5547d62ca.
    back to text
  7. Harry Enten (2014) “How Much Do Democrats Depend on the Union Vote?” FiveThirtyEight, July 1, 2014, http://fivethirtyeight.com/datalab/supreme-court-ruling-wounds-both-democrats-and-unions-neither-fatally/; CNN politics (2016) “national president”, http://edition.conn.com/results/exit-polls.
    back to text
  8. Kim Moody (2007) US Labor in Trouble and Transition: The Failure of Reform from Above, The Promise of Revival from Below. London: Verso, 145.
    back to text
  9. Roper Center, “How Groups Voted,”1980, 2014, http://ropercenter.cornell.edu/polls/us-elections/how-groups-voted/how-groups-voted/; CNN politics (2016).
    back to text
  10. Roper Center, “How Groups Voted,” 1996, 2000, http://ropercenter.cornell.edu/polls/us-elections/how-groups-voted/how-groups-voted/.
    back to text
  11. McElwee, Sean (2015) “Why Non-Voters Matter,” The Atlantic, September 15, 2015, http://www.theatlantic.com/politics/archive/2015/09/why-non-voters-matter/405.
    back to text
  12. Donald Green and Michael Schwam-Baird (2016) “Mobilization, participation, and American democracy: A retrospective and postscript,” Party Politics, March 2016, 22(2):158-164; NCSL (2016b) “Voter Identification Requirements / VoterID Laws,” National Conference of State Legislatures, http://www.ncsl.org/research/elections-and-campaigns/voter-id.aspex.
    back to text
  13. Politics & Policy (2016) “Campaigns and Voter Infor­mation: Elections in a Digital Age,” http://politicsandpolicy.org/article/campaigns-and-voter-information-elections-digital-era; Max Willens (2016) “Election 2016Ads: Xaxis Will Target Voters Using Their Digital And Real-Life Data”, ibtimes, November 9, 2015, www.ibtimes.com/election-2016-political-ads-xaxis-will-target-voters-using-their-digital-real-life-2176196; DSPolitical (2016) “NGP VAN and DSPolitical Join Forces Bringing Self-Serve Voter Targeted Digital Advertising to Nearly Every Democratic Campaign in America,” http://dspolitical.com/press-releases/voter-targeted-ads-now-fingertips-thousands-democratic-campaigns; Sreenivasan, Hari (2012) “The Digital Campaign” transcript, PBS, http://www.pbs.org/wgbh/frontline/film/digital-campaign/transcript/.
    back to text
  14. Davies, Harry and Danny Yadron, “How Facebook tracks and profits from voters in a $10bn election,” The Guardian, January 28, 2016, www.theguardian.com/us-news/2016//jan28/facebook-voters-us-election-fed-cruz-targeted-ads-trump; Green and Schwam-Baird (2016), 158-164; Willens (20126; DSPolitical (2016).
    back to text
  15. Harry Davies and Danny Yadron, “How Facebook tracks and profits from voters in a $10bn election,” The Guardian, January 28, 2016, www.theguardian.com/us-news/2016/jan28/facebook-voters-us-electionfed-cruz-targeted-ads-trump.
    back to text
  16. John Nichols (2016) “Hillary Clinton’s Popular-Vote Victory Is Unprecedented — and Still Growing,” The Nation, November 17, 2016, https://www.thenation.com/article/hillary-clintons-popular-vote-victory-is-unprecedented-and-still-growing/; New York Times (2016c) Election 2016 “New York Results,” http://www.nytimes.com/elections/results/new-york.
    back to text
  17. United States Elections Project (2016) “2016 November General Election Turnout Rates,” http://www.electproject.org/2016g; Thom File (2015), 3.
    back to text
  18. Sean McElwee (2014) “Why The Voting Gap Matters,” Demos, October 23, 2014, http://www.demos.org/publication/why-voting-gap-matters; Sean McElwee (2015); Pew Research Center (2014) “The Party of the Nonvoters” October 11, 2014, http://www.people-press.org/2014/10/31/the-party-of-nonvoters-2/.
    back to text
  19. US House of Representatives (2016) “Party Divisions of the House of Representatives,” http://history.house.gov/Institution/Party-Divisions/Party-Divisions/; Thom File (2015) Who Votes? Congressional Elections and the American Electorate: 1978-2014. Washington DC: U.S. Department of Commerce, 3; NCSL (2009) “2009 State and Legislative Partisan Composition,” National Conference of State Legislatures, http://www.ncsl.org/documents/statevote/legiscontrol_2009.pdf.
    back to text
  20. NCSL (2009); NCSL (2015) “2015 State and Legislative Partisan Composition,” National Conference of State Legislatures, http://www.ncsl.org/documents/statevote/legiscontrol_2015.pdf.
    back to text
  21. File (2015), 1-4.