By Roger Boyd, Humanity's Test, April 24, 2017
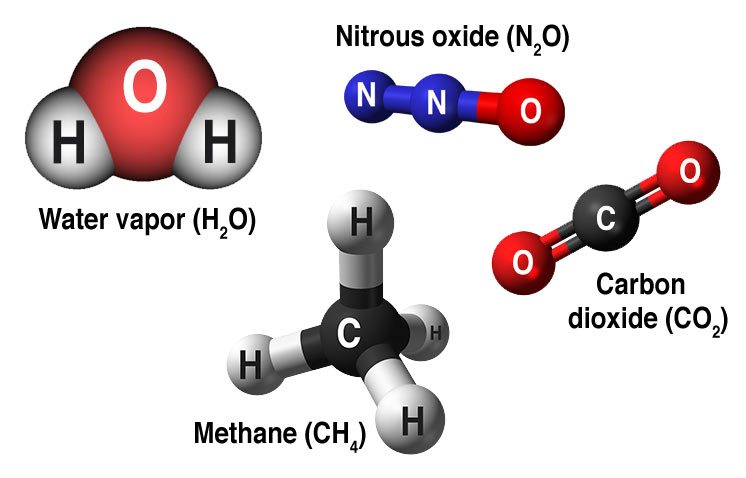
Carbon dioxide is not the only greenhouse gas; the most important others are methane (CH4) and nitrous oxide (N2O). Methane has about 84 times the climate warming effect that CO2 does in the first twenty years (after 20 years the majority is converted to CO2)[i], a major issue as the climate moves toward possible positive-feedback tipping points. Over a hundred year period CH4 has a warming impact 34 times that of CO2[ii]. Nitrous Oxide has about 300 times the warming impact of CO2and has an atmospheric lifespan of over 100 years[iii] [iv].
The biggest drivers of anthropogenic methane are agriculture (especially cattle and water-logged fields of rice) and leaks from natural gas (which is mostly methane) production and distribution. After leveling off at the start of the first decade of the twenty-first century, atmospheric methane levels started to climb again in 2007[v]. A lot of evidence points to a significant part of the increase as coming from the massive growth in shale gas wells in the United States[vi]. The 30% increase in U.S. methane emissions may well offset its’ celebrated reduction in CO2 emissions in recent years. Australia may have also been significantly underreporting the methane emissions from its rapidly growing coal seam gas operations[vii].
The extensive use of nitrogen fertilizers in agriculture has the side effect of directly releasing N2O. Another source is decomposing animal manure[viii]. Other sources are fossil fuel extraction and some industrial processes. Concentrations of atmospheric N2O have increased at a constant rate, accelerating somewhat at the end of the last century, mainly reflecting the growth in industrialized agriculture and meat consumption.
The level of CFC gases in the atmosphere stabilized, and then started on a downward trend after the 1987 Montreal Accord took affect to protect the ozone layer. In contrast, HFC’s and HCFC’s (ironically replacements for CFC’s), the most common of which has a warming potential 1,430 times greater than CO2[ix], have greatly increased since the mid-1990’s as the use of air conditioning spread rapidly. These will be limited by an international agreement reached in 2016[x]
Trends in Major Greenhouse Gases

Source: NOAA at https://www.esrl.noaa.gov/gmd/aggi/aggi.fig2.png
Combining all the greenhouse gases together on a CO2 equivalent basis, the U.S. National Oceanic and Atmospheric Administration (NOAA), produces an Annual Greenhouse Gas Index (AGGI)[xi]. The AGGI is higher than the CO2 only measure, given the impact of the other gases, standing at a level of 485 ppm CO2 equivalent in 2015. It is also increasing faster than the level of CO2 only, at a rate of 3-4ppm per year since 2010 (compared to a rate of just over 2ppm for CO2). At the current rate of increase the CO2e will hit 500 ppm before 2020 – a level that will overshoot the 2 degree centigrade U.N. warming limit. With atmospheric levels of CO2 recently jumping at a rate of 3ppm per year, CO2e levels could soon be increasing at 4-5ppm per year. A level of 550 ppm CO2e, consistent with a 3 degree centigrade rise in temperatures, would then be reached in the early 2030’s.
The only way to radically reduce anthropogenic emissions of methane and nitrous oxide would be to fundamentally change industrial agriculture practices, reduce meat consumption, and significantly reduce emissions from natural gas usage. None of these seem to be probable in the near future, with the U.S. government recently moving to remove regulations on shale gas methane emissions, natural gas usage increasing rapidly as a “climate friendly” alternative to coal, and worldwide meat consumption rapidly increasing.
NOAA Annual Greenhouse Gas Index (AGGI)

Source: NOAA at https://www.esrl.noaa.gov/gmd/aggi/aggi.fig5_med.png
China’s Iffy Coal Statistics
In late 2015, China announced that it had previously underestimated its usage of coal by 17%[xii]. The increase in the country’s stated greenhouse gas emissions was equal to the emissions of the whole of Germany! So the recent celebration of the global stabilization of anthropogenic carbon emissions, mainly due to reductions in China’s coal usage, may be proven to be premature. It may be best to wait a few years for any possible future data revisions by China.
Schemes to purchase fraudulent carbon credits
Countries are allowed to buy carbon credits from other countries to offset their own emissions, through Emission Trading Schemes. New Zealand bought a huge amount of credits from the Ukraine and Russia that may be completely fraudulent – representing no real emission reductions in those countries at all[xiii]. The New Zealand government plans to use these credits to meet the country’s emission reduction commitments through 2020 and beyond. All of those extra credits also crashed the price of credits to effectively zero in New Zealand, producing incentives to actually increase emissions in the large agricultural sector (and blocking the possibility of increased forestry to capture carbon). In effect, New Zealand will not be reducing emissions at all through 2020 and instead will count fraudulent credits to say that it has met its targets.
New Zealand is the worst per capita ETS cheat, but many other countries got into the game as well. Many of those countries have decided to relinquish any excess credits though, meaning that those credits will not be used to offset future emissions[xiv]. With the great difficulty of validating that carbon credits reflect actual reductions in emissions that would not have happened otherwise, the possibility of widespread fraud will always be a reality. The purchase of emissions credits between countries should simply be abolished, forcing countries to do the hard work of actually reducing their own emissions.
Overestimating historical emissions to up the baseline for emissions cuts
It seems that Australia has been dramatically overstating its carbon emissions since 2000, meaning that it can meet its emission targets with little real action being required[xv]. Given the over-estimates the country may very well overshoot its 2020 commitment (5% reduction in emissions vs. 2000) and be able to carry this overshoot forward to future years. Australia also has a bunch of fake carbon credits from Russia and the Ukraine as well, so it may be “business as usual” in that country for many years to come. Then of course, there is all that methane from the rapidly growing unconventional gas industry…
Counting All Biofuels as Carbon Neutral or Low Carbon
Countries such as Germany and the United Kingdom have greatly increased their use of biofuels to generate electricity. In the case of Germany, which uses more local waste products for its biofuel, it may in fact be relatively close to carbon neutral. In the case of the large scale burning of wood pellets from North America by the UK (it is now the world’s largest importer of wood pellets), the practice is definitely not carbon neutral. Where whole trees are turned into pellets, the practice may be worse than burning coal[xvi]. Whatever biomass is used, there is also the issue that the carbon is emitted up front with the balancing carbon uptake possibly taking many decades. These immediate emissions could help drive atmospheric GHG levels beyond possible tipping points in the short term[xvii].
There is also the use of palm oil to produce biodiesel, which has resulted in widespread deforestation and peatland destruction in Indonesia and Malaysia while being counted as a low carbon fuel. The use of palm oil for biodiesel by the European Union countries showed a five-fold increase between 2010 and 2014. A recent report estimated that emissions from biodiesel are three times that of conventional dieselwhen indirect effects are considered[xviii]. The EU does seem to have woken up to this problem, and is now looking to limit the use of biodiesel, especially from palm oil.
Excluding Shipping. Aviation, and Overseas Military Operations
The targets set at the Paris Climate Talks, and the statistics on carbon emissions, exclude shipping and aviation. Shipping produces about 3% of global emissions[xix], and aviation about 2% of emissions. The warming effects of aviation emissions, which are vented at altitude, are between 2-4 times that of surface emissions[xx]. So shipping plus aviation is probably equal to about 9% of anthropogenic carbon dioxide emission impacts, and both are growing rapidly.
Overseas military operations are also not included; a huge issue for the United States that has an extensive worldwide network of bases and is involved in a number of foreign military operations. Only some of the resulting emissions will be captured in another country’s statistics. Military spending is continuing to expand, with little accurate accounting for the fossil fuel usage and climate change impact[xxi]. Given the huge scale of military operations across the globe, and their massive dependence upon intense fossil fuel usage, they must account for at least a few percent of global emissions.
A Much Simpler Way: A Carbon Price Dependent Upon The Increase In Atmospheric GHG Levels
A much simpler solution would be to measure the actual levels of greenhouse gases in the atmosphere, as we do today, and set a global carbon tax based on their levels of increase/decrease – on a CO2equivalent basis. No chance of cheating, or bureaucratic obfuscation and error. Given that CO2 equivalent levels of GHG’s are increasing at an alarming rate of 3-4ppm per year, a very high carbon tax would be required. Human society would have to deal with the incredibly tough decisions required to reduce atmospheric GHG emissions to levels consistent with the Earth’ ability to continue to support our complex civilizations. Not something that those in power seem to want to deal with.
References
[i] U.S. Environmental Protection Agency (2017), Understanding Global Warming Potentials, U.S. E.P.A. Accessible at https://www.epa.gov/ghgemissions/understanding-global-warming-potentials
[ii] Joe Romm (2013), More Bad News For Fracking: IPCC Warns Methane Traps Much More Heat Than We Thought, Think Progress. Accessible at https://thinkprogress.org/more-bad-news-for-fracking-ipcc-warns-methane-traps-much-more-heat-than-we-thought-9c2badf392df
[iii] U.S. Environmental Protection Agency (2017), Understanding Global Warming Potentials, U.S. E.P.A. Accessible at https://www.epa.gov/ghgemissions/understanding-global-warming-potentials
[iv] The Conversation (2014), Meet N2O, the greenhouse gas 300 times worse than CO2, The Conversation. Accessible at https://theconversation.com/meet-n2o-the-greenhouse-gas-300-times-worse-than-co2-35204
[v] M. Saunois et. al. (2016), The growing role of methane in anthropogenic climate change, Environmental Research Letters https://doi.org/10.1088/1748-9326/11/12/120207. Accessible at http://iopscience.iop.org/article/10.1088/1748-9326/11/12/120207
[vi] A. J. Turner et. al. (2016), A large increase in U.S. methane emissions over the past decade inferred from satellite data and surface observations, Geophysical Research Letters doi:10.1002/2016GL067987. Accessible at http://acmg.seas.harvard.edu/publications/2016/Turner_GRL_2016_Methane.pdf
[vii] Dimitri Lafleur (2016), A review of current and future methane emissions from Australian unconventional oil and gas production,Melbourne Energy Institute. Accessible at http://www.tai.org.au/sites/defualt/files/MEI%20Review%20of%20Methane%20Emissions%20-%2026%20October%202016.pdf
[viii] Robert Sanders (2012), Fertilizer use responsible for increase in nitrous oxide in atmosphere, Berkeley News. Accessible at http://news.berkeley.edu/2012/04/02/fertilizer-use-responsible-for-increase-in-nitrous-oxide-in-atmosphere/
[ix] Robynne Boyd (2016), World leaders discuss ban of climate-busting refrigerants, Nature / Scientific American. Accessible at http://www.nature.com/news/world-leaders-discuss-ban-of-climate-busting-refrigerants-1.20768
[x] Chris Johnston et. al. (2016), Climate change: global deal reached to limit use of hydrofluorocarbons, The Guardian. Accessible at https://www.theguardian.com/environment/2016/oct/15/climate-change-environmentalists-hail-deal-to-limit-use-of-hydrofluorocarbons
[xi] NOAA (2017), THE NOAA ANNUAL GREENHOUSE GAS INDEX (AGGI),NOAA. Accessible at https://www.esrl.noaa.gov/gmd/aggi/aggi.html
[xii] Chris Buckley (2015), China Burns Much More Coal Than Reported, Complicating Climate Talks, The New York Times. Accessible at https://www.nytimes.com/2015/11/04/world/asia/china-burns-much-more-coal-than-reported-complicating-climate-talks.html
[xiii] Isaac Davidson (2016), New Zealand’s carbon credits scheme a farce, says Morgan Foundation report, New Zealand Herald. Available at http://www.nzherald.co.nz/nz/news/article.cfm?c_id=1&objectid=11624441
[xiv] Morgan Foundation (2016), Climate Cheats, Morgan Foundation. Accessible at http://morganfoundation.org.nz/wp-content/uploads/2016/04/ClimateCheat_Report9.pdf
[xv] Lenore Taylor (2015), Australia overstating greenhouse gas forecasts, making climate targets easier, The Guardian. Accessible at https://www.theguardian.com/environment/2015/jun/10/australia-overstating-greenhouse-gas-forecasts-making-climate-targets-easier
[xvi] Duncan Brack (2017), Wood Is Not a Carbon-Neutral Energy Source,Chatham House. Accessible at https://www.chathamhouse.org/expert/comment/wood-not-carbon-neutral-energy-source
[xvii] Jocelyn Timperly (2017), Biomass subsidies not fit for the purpose,Carbon Brief. Accessible at https://www.carbonbrief.org/biomass-subsidies-not-fit-for-purpose-chatham-house
[xviii] Arthur Neslen (2016), Leaked figures show spike in palm oil use for biodiesel in Europe, The Guardian. Accessible at https://www.theguardian.com/environment/2016/jun/01/leaked-figures-show-spike-in-palm-oil-use-for-biodiesel-in-europe
[xix] Shane MacLachlan (2016), Carbon emissions all at sea: why was shipping left out of the Paris Climate Agreement?, OECD Insights. Accessible at http://oecdinsights.org/2016/05/04/carbon-emissions-all-at-sea-why-was-shipping-left-out-of-the-paris-climate-agreement/
[xx] David Suzuki Foundation (2017), Air Travel & Climate Change, David Suzuki Foundation. Accessible at http://www.davidsuzuki.org/issues/climate-change/science/climate-change-basics/air-travel-and-climate-change/
[xxi] James Wilt (2017), Canada Still Doesn’t Know How Much Pollution Its Military Emits, VICE. Accessible at https://www.vice.com/en_ca/article/canada-still-doesnt-know-how-much-pollution-its-military-emits
No comments:
Post a Comment